Form is one of the most instinctive inputs a football bettor uses. A team winning five in a row looks like a safe bet. A team losing four straight looks like a team to avoid, or, depending on your theory, one due a bounce-back win. Both instincts make intuitive sense. Both are also priced in by bookmakers before you can act on them.
We tested form across 360,000+ team-match observations from 22 leagues and 26 seasons of history. The data answers three specific questions: does form predict results, does the market price it accurately, and is there any betting edge available from form-based selection?
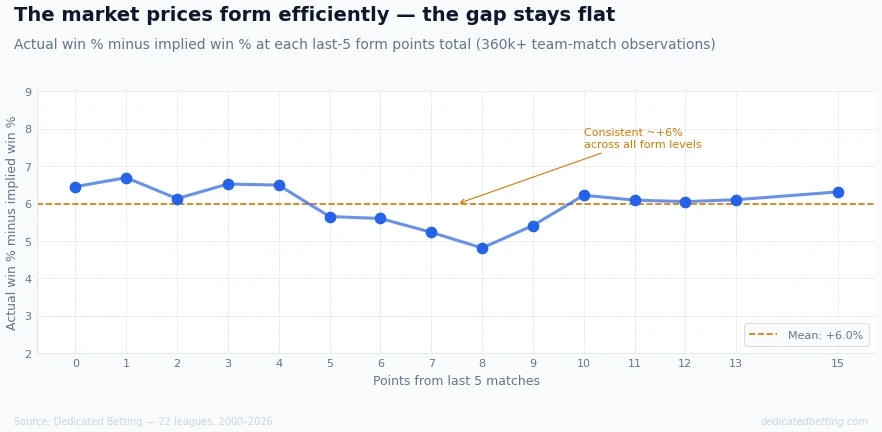
Key finding: Form predicts results clearly - teams with excellent recent form win significantly more often than teams in poor form. But the market adjusts odds proportionally for form at every level. The actual win rate above the implied probability stays flat at approximately +6% across every form band and every streak length. There is no systematic edge from backing teams because of their recent form.
What "Pricing Form Accurately" Means
Before the data, the concept.
When a bookmaker sets odds, they build an implied probability into the price. A team at 2.00 implies a 50% chance of winning. At 1.50 it implies 66.7%. The gap between actual win rate and implied probability, across thousands of matches, tells you how accurately the market is pricing a given category of team.
If that gap were consistently large and positive for in-form teams, it would mean the bookmaker isn't shortening odds enough for form, a potential edge for us sports bettors. If the gap is consistently negative, the bookmaker would be over-shortening, an indication of overpricing.
Our data measures this gap across every form band and streak length. The result is the chart above: the gap stays flat at approximately +6% regardless of form. The +6% is simply the bookmaker's margin, applied consistently. The market sees the same form data you do.
Form Bands: What the Last 5 Matches Tell You
| Form band | Matches | Actual win % | Implied win % | Gap |
|---|---|---|---|---|
| 0–3 pts (poor) | 63,020 | 31.8% | 25.3% | +6.5% |
| 4–6 pts (below avg) | 96,032 | 34.0% | 28.1% | +5.9% |
| 7–9 pts (average) | 88,568 | 37.1% | 31.9% | +5.2% |
| 10–12 pts (good) | 45,755 | 43.7% | 37.6% | +6.1% |
| 13–15 pts (excellent) | 14,243 | 52.4% | 46.2% | +6.2% |
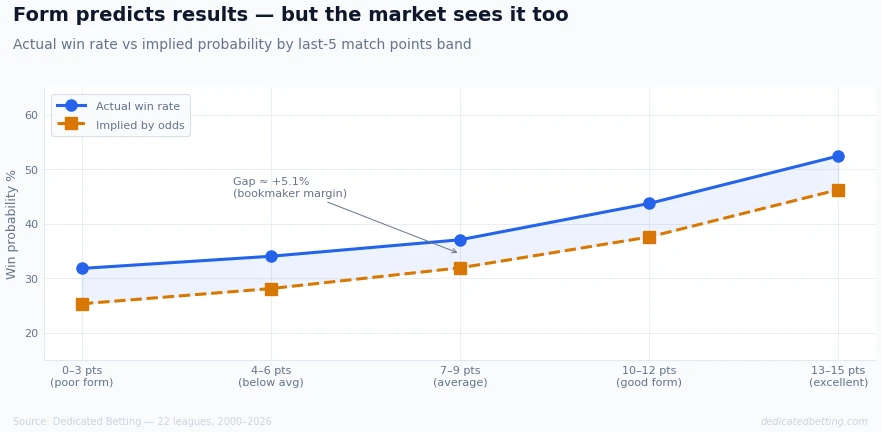
The predictive signal is strong: teams with 13–15 points from their last 5 matches win 52.4% of the time versus 31.8% for teams with 0–3 points. That is a 20+ percentage point difference in actual outcomes.
But the bookmaker does adjust their odds to match. The gap column stays between 5.2% and 6.5% across all five bands. Teams in excellent form are backed at short enough odds that the betting ROI is no better than backing teams in poor form. The market is not overpricing poor-form teams or underpricing in-form ones in any consistent way.
Winning Streaks: Does the Market Miss Momentum?
A common theory in betting content is that bookmakers underestimate momentum, that teams on winning runs continue to outperform their odds because the market cannot fully adjust for confidence, rhythm, and tactical cohesion built through a streak. The data tests this directly.
Across all 22 leagues, teams entered matches on the following consecutive winning streaks. The ROI figures show what backing them blindly at best available odds produced:
| Win streak | Matches | Win rate | ROI | Actual vs implied |
|---|---|---|---|---|
| No streak | 224,850 | 35.4% | −6.7% | +6.4% |
| 1 win | 80,883 | 36.0% | −7.3% | +6.3% |
| 2 wins | 28,332 | 40.6% | −8.3% | +5.9% |
| 3 wins | 11,148 | 43.9% | −7.0% | +6.0% |
| 4 wins | 4,765 | 49.0% | −5.7% | +6.4% |
| 5+ wins | 4,784 | 56.3% | −5.7% | +5.5% |
Win rates improve steadily and substantially with streak length, from 35.4% for teams with no winning streak to 56.3% for teams on five or more consecutive wins. The market captures this entirely. The actual-vs-implied gap stays between 5.5% and 6.4% throughout.
The slight improvement in ROI at longer streaks (−5.7% for 5+ versus −6.7% for no streak) is not evidence of an edge. It reflects the fact that teams on long winning streaks are priced as shorter-odds favourites, and the bookmaker margin is smaller in absolute terms at shorter odds. The market is not underpricing momentum.
Losing Streaks: Is There a Contrarian Edge?
The opposite theory: teams on losing streaks are underpriced because bookmakers and bettors alike overreact to recent poor form, pushing prices out. Backing them against the crowd should produce positive expected value.
| Loss streak | Matches | Win rate | ROI | Actual vs implied |
|---|---|---|---|---|
| No streak | 225,056 | 37.8% | −7.0% | +6.6% |
| 1 loss | 81,044 | 36.8% | −6.8% | +6.1% |
| 2 losses | 29,054 | 32.6% | −7.1% | +5.9% |
| 3 losses | 11,401 | 31.6% | −6.6% | +6.0% |
| 4 losses | 4,679 | 30.0% | −2.9% | +6.7% |
| 5+ losses* | 1,982 | 27.1% | −10.2% | +5.3% |
-
The contrarian edge does not appear. Backing teams on four consecutive losses produces the best ROI in the table at −2.9%, but it is still negative. The actual-vs-implied gap stays in the +5.3% to +6.7% range throughout, the market is adjusting odds for poor form at the same rate that form actually predicts results.
-
The 5+ losses group returns −10.2% ROI, the worst in the table. The sample is 1,982 matches, large enough to be meaningful. The market is, if anything, not shortening odds enough on teams in extended poor form.
-
The 5+ group covers streak lengths 5 and above. Beyond 6 consecutive losses, sample sizes fall below 1,000 and individual data points become unreliable.
Era Trend: Has Form Become More Efficiently Priced?
One nuance worth examining: has the market always priced form this accurately, or has it improved over time? Our era breakdown covers four periods from 2000 to 2026.
The actual-vs-implied gap for teams on winning streaks by era:
| Era | No streak AVI | 4+ wins AVI |
|---|---|---|
| 2000–2010 | +4.4% | +5.4% |
| 2010–2020 | +6.8% | +7.2% |
| 2020–21 Covid | +8.4% | +6.6% |
| 2021–2026 | +7.9% | +6.9% |
The gap has widened over time, the bookmaker margin has grown, not because form is priced less accurately, but because the overall margin applied across all markets has increased. The key point is that the gap is consistently similar across streak lengths within each era. Even in the 2000–2010 era, when the overall market was less efficient, the gap was similar for teams with no streak versus teams on long winning runs.
The market has priced form consistently throughout our database period. There is no historical era where backing teams specifically because of form produced systematic profit.
What This Means for Betting
The finding does not mean form is irrelevant to betting. It means form alone, as a selection criterion, does not create an edge. The reason is that the bookmaker has access to exactly the same form data you do and adjusts odds accordingly.
Form becomes relevant as one input into a probability estimate that goes beyond what the bookmaker's model already prices. If your assessment of a team's current trajectory, incorporating factors like injury context, opposition quality during the streak, tactical changes, or schedule difficulty, leads you to a probability estimate that differs meaningfully from the odds, that is where potential value lies. The value is in the divergence from the market's assessment, not in the form signal itself.
The supporting articles in this series test more specific questions:
- Does last-5 form predict football results? - the predictive signal in detail, and why it doesn't translate to ROI
- Are teams on winning streaks overpriced? - streak-by-streak analysis including the home/away split
- Do losing streaks represent betting value? - the contrarian theory tested across 370,000 matches
Using Dedicated Betting Data for Form Assessment
The team pages on this site show current-season Home vs Away Form for every team across 22 leagues - including points per game, win rate, and goals data for the last 5, 10, and 38 matches. This data is useful not because it tells you who is in form (the bookmaker already knows), but because it shows how teams are performing relative to expectations and whether current form reflects structural quality or variance.
A team averaging 2.3 PPG over the last 5 matches but 1.4 PPG over the full season is likely experiencing a positive variance streak, the form is real but probably unsustainable. A team averaging 1.6 PPG over both windows has structural consistency. The distinction matters when assessing whether current odds are pricing temporary form or genuine underlying quality.
League pages show current-season home advantage data, which feeds into whether a team's winning streak has been built predominantly at home (where it may be more fragile away) or across both venues. Rankings allow direct comparison of form windows across all 22 leagues simultaneously.
Summary
Form is a genuine predictor of football results. Teams with 13–15 points from their last 5 matches win 52% of the time; teams with 0–3 points win 32%. The 20-percentage-point gap is real and consistent.
The market prices this gap accurately. The actual win rate above the implied probability stays flat at approximately +6% (the bookmaker's margin) across every form band and every streak length tested across 360,000+ observations. Backing teams because of their form, or against teams because of their poor form, does not produce a systematic betting edge.
Final thought: The market sees the same form data you do. What it cannot price is information you have that goes beyond what form numbers show, context, trajectory, and factors that affect the next result but aren't captured in the last five scorelines. That is where analysis earns its place.
All figures from the Dedicated Betting database. Win streak and loss streak data: 353,000+ team-match observations across 22 leagues, 2000–2026, excluding each team's first match of each season. Last-5 form band data: 360,000+ observations requiring a full 5-game prior window. Best available odds methodology (Max → Average). Streaks defined within division, resetting at season boundaries.
Related articles
Football betting strategy: the full data picture
Selection system ROI across 182,000 matches including the era efficiency trend: Football Betting Strategy.
Is betting on favourites profitable?
The home/away favourite split and era trend - a related market efficiency analysis: Is Betting on Favourites Profitable.