The theory is intuitive: bookmakers shorten odds too aggressively for teams on winning runs, making them poor value. Alternatively, momentum is real and teams on streaks continue to outperform. Both versions of this argument appear regularly in betting analysis. Both are testable.
We tested every winning streak length from 1 to 10+ consecutive wins across 22 leagues and 26 seasons. The data addresses both theories directly.
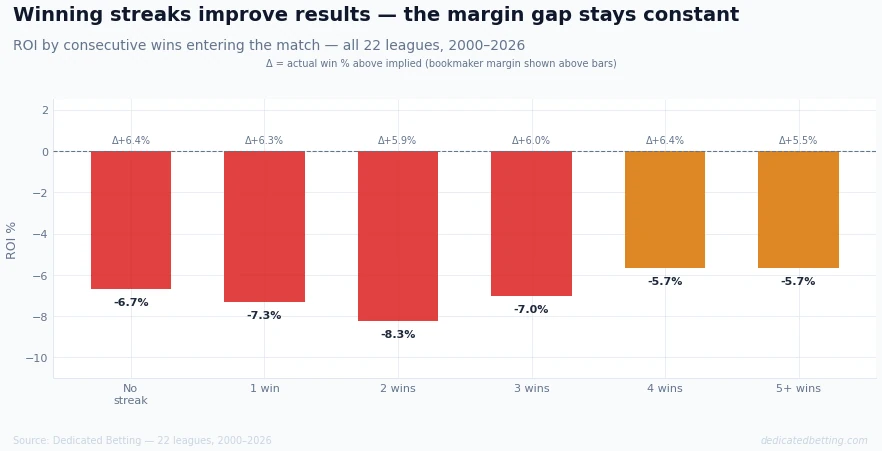
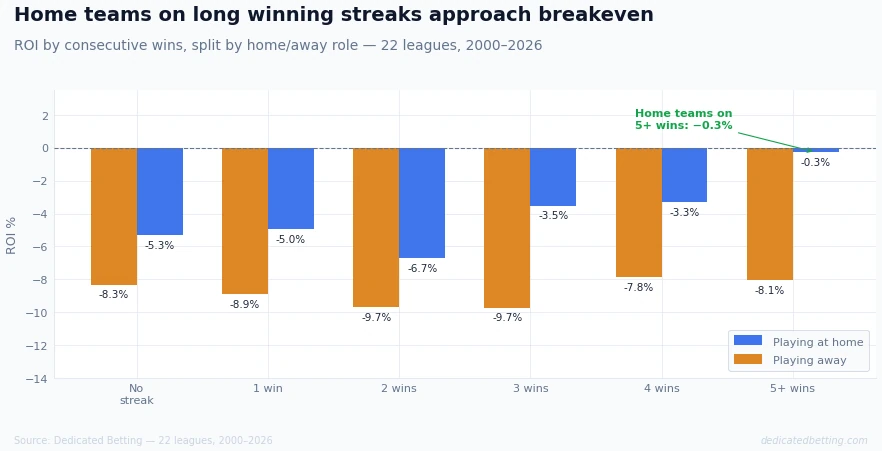
Key finding: Teams on winning streaks win significantly more often as streaks lengthen, but the bookmaker adjusts odds proportionally. The actual win rate above implied probability stays flat at approximately +6% across all streak lengths. Teams on 5+ winning streaks are not overpriced. The one partial exception: home teams on long winning streaks return close to breakeven ROI, approaching −0.3% at 5+ wins.
Streak Length and Win Rate
Before the ROI figures, the raw prediction question: do teams on longer winning streaks actually win their next match more often?
Yes, substantially. Across 353,000+ observations (excluding each team's first match of each season where no prior form exists):
| Win streak | Matches | Win rate | Avg odds | ROI | Actual vs implied |
|---|---|---|---|---|---|
| No streak | 224,850 | 35.4% | 3.44 | −6.7% | +6.4% |
| 1 win | 80,883 | 36.0% | 3.37 | −7.3% | +6.3% |
| 2 wins | 28,332 | 40.6% | 2.88 | −8.3% | +5.9% |
| 3 wins | 11,148 | 43.9% | 2.64 | −7.0% | +6.0% |
| 4 wins | 4,765 | 49.0% | 2.35 | −5.7% | +6.4% |
| 5+ wins | 4,784 | 56.3% | 1.98 | −5.7% | +5.5% |
Win rate rises from 35.4% with no streak to 56.3% on a 5+ game run. Average odds fall from 3.44 to 1.98. The market is shortening prices significantly as streaks lengthen, and doing so at a rate that matches the actual improvement in results. The actual-vs-implied gap remains between 5.5% and 6.4% throughout.
Teams on winning streaks are neither overpriced nor underpriced in aggregate. The ROI at 5+ wins (−5.7%) is marginally better than no streak (−6.7%), but the difference is driven by the shorter odds at which in-form teams are priced, shorter-priced bets have lower absolute margin exposure, not by a systematic pricing error.
The Home/Away Split
The aggregate figures hide a more specific finding. Split the data by whether the team on a winning streak is playing at home or away:
| Win streak | Home ROI | Away ROI |
|---|---|---|
| No streak | −5.3% | −8.3% |
| 1 win | −5.0% | −8.9% |
| 2 wins | −6.7% | −9.7% |
| 3 wins | −3.5% | −9.7% |
| 4 wins | −3.3% | −7.9% |
| 5+ wins | −0.3% | −8.1% |
Home teams on a 5+ game winning streak return −0.3% ROI across 1,036 matches. This is the closest to breakeven of any category in our entire form dataset. Away teams on the same streak return −8.1% - meaningfully worse than the equivalent home team category.
The interpretation requires care. Home teams on long winning streaks are typically strong domestic sides priced as short-odds favourites. The −0.3% ROI is close to breakeven but is not positive, and the sample of 1,036 matches, while not small, is concentrated among a subset of the market (strong home teams in winning runs). This is an observation that warrants attention, not a reliable edge.
The home advantage explanation is also relevant: a home team on a winning streak has likely built that streak predominantly at home, where their advantage is structural. The odds may not fully capture the compounding of home advantage and recent form. Alternatively, the market may be pricing these teams at their true level and the −0.3% figure is within normal variance around zero.
Era Breakdown: Has Streak Pricing Changed?
| Era | No streak ROI | 4+ wins ROI | No streak AVI | 4+ wins AVI |
|---|---|---|---|---|
| 2000–2010 | −10.9% | −5.6% | +4.4% | +5.4% |
| 2010–2020 | −5.6% | −6.5% | +6.8% | +7.2% |
| 2020–21 Covid | +0.5% | −0.7% | +8.4% | +6.6% |
| 2021–2026 | −3.9% | −5.2% | +7.9% | +6.9% |
The era data shows the same pattern across all four periods: the actual-vs-implied gap is similar whether teams are on a winning streak or not. There is no historical era in which backing teams specifically on a winning streak produced systematically better ROI than backing teams with no streak.
The overall improvement in ROI across eras (from −10.9% to −3.9% for no-streak teams) reflects the broader market efficiency trend documented in our football betting strategy article - the overall market margin has been applied more consistently over time.
What to Do With This Information
The data does not suggest ignoring winning streaks. It suggests understanding what they do and don't tell you.
A winning streak is evidence of recent performance. It does not tell you why the team is winning, whether the wins have been against strong or weak opposition, whether key players are at full fitness, or whether the streak is sustainable through a more difficult upcoming schedule. The bookmaker's odds already reflect the streak and its basic statistical implications.
The value question is always: does your assessment of this specific fixture, in this specific context, lead to a probability estimate that differs from the implied probability in the odds, and does it differ by more than the bookmaker's margin? If a team is on a 6-game winning streak but faces a significant step up in opposition quality and has injury concerns, the odds may not have fully adjusted for those factors. The streak alone is not the edge; the streak in a specific context, assessed against the specific price, is where analysis works.
The team pages show home and away form separately, allowing you to distinguish teams whose winning streaks have been built at home versus across both venues, a relevant input when the next fixture is away.
Summary
Teams on winning streaks win their next match significantly more often as streak length increases, from 35.4% win rate with no streak to 56.3% on five or more consecutive wins. The bookmaker shortens odds at the same rate. The actual-vs-implied gap stays at approximately +6% across all streak lengths.
The one exception worth noting: home teams on 5+ game winning streaks return −0.3% ROI across 1,036 matches, the closest to breakeven category in our form dataset. This is an observed pattern in the data, not a validated edge.
Final thought: Winning streaks are efficiently priced. The market neither over-shortens nor under-shortens for momentum. The only partial exception is home teams on extended runs, and even there the ROI is marginally negative. The streak is already in the price, what you need is insight beyond the streak.
Data: 353,000+ team-match observations excluding each team's first match of each season, 22 leagues, 2000–2026. Streak defined as consecutive wins within division, resetting at season boundary. Best available odds: Max → Average.
Related articles
Do losing streaks represent betting value?
The contrarian theory, backing teams in extended poor form, tested across the same dataset: Do Losing Streaks Represent Betting Value.
Does form matter in football betting? (Pillar)
The full market efficiency analysis across form bands, streaks, and eras: Does Form Matter in Football Betting.