Last 5 match form is the most commonly referenced form metric in football betting, the default window shown on fixture lists, used by tipsters, and cited in match previews. The question is whether it actually predicts results, and if so, whether that predictive power translates to any betting edge.
The short answers: yes it predicts results, and no it doesn't create an edge. Here is why both are true simultaneously.
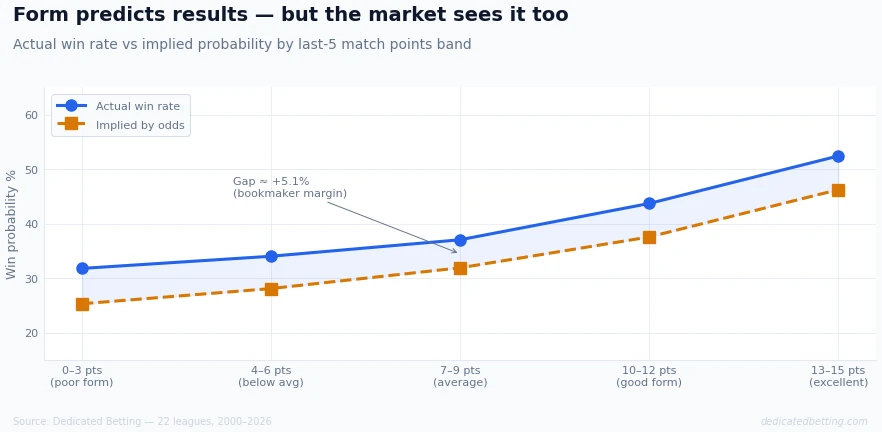
Key finding: Teams with 13–15 points from their last 5 matches win 52.4% of next-match observations versus 31.8% for teams with 0–3 points, a 21-percentage-point gap. The market accounts for this entirely, shortening odds for good-form teams at the same rate. Across all five form bands, the gap between actual win rate and implied probability stays within one percentage point of +6%.
The Predictive Signal Is Real
Across 360,000+ team-match observations requiring a full 5-game prior window, the relationship between last-5 form and next-match win rate is clear and consistent.
| Form band | Matches | Actual win % | Implied win % | Gap | ROI |
|---|---|---|---|---|---|
| 0–3 pts (poor) | 63,020 | 31.8% | 25.3% | +6.5% | −6.1% |
| 4–6 pts (below avg) | 96,032 | 34.0% | 28.1% | +5.9% | −6.4% |
| 7–9 pts (average) | 88,568 | 37.1% | 31.9% | +5.2% | −8.6% |
| 10–12 pts (good) | 45,755 | 43.7% | 37.6% | +6.1% | −6.0% |
| 13–15 pts (excellent) | 14,243 | 52.4% | 46.2% | +6.2% | −6.1% |
The range from 31.8% to 52.4% win rate is a substantial and statistically meaningful signal, this is not noise. Teams in excellent last-5 form genuinely win more often than teams in poor form. The data is unambiguous on this.
The ROI column is equally unambiguous: every form band loses. The range is −6.0% to −8.6%, with no systematic pattern of one band being meaningfully better or worse than another after accounting for odds. The bookmaker margin is applied consistently across all form bands.
Why the Predictive Signal Doesn't Create an Edge
The gap column is the explanation. At every form band, the actual win rate exceeds the implied probability by between 5.2% and 6.5%. This gap, approximately +6% throughout, is the bookmaker's overround applied to each match. It doesn't change because the team is in form or out of form.
The implication: bookmakers shorten odds for good-form teams at exactly the rate that good form predicts extra wins. The odds for a team with 13–15 points already reflect a ~46% chance of winning. The actual rate is ~52%. The 6-point gap is the margin, not exploitable value.
This is the core finding of form-based market efficiency: the bookmaker sees the same last-5 data you do. The form table on the fixtures page is not private information, it's the first thing a trading algorithm updates after each result.
The 7–9 Band Anomaly
One observation worth noting: the 7–9 points band (average form) shows the highest ROI loss at −8.6%, slightly worse than the surrounding bands. This is not because average-form teams are being mispriced, the gap column for this band (+5.2%) is the lowest in the table, suggesting the market is actually pricing them very efficiently. The worse ROI comes from the distribution of match types in this category: average-form teams are more often in evenly-matched fixtures where the margin is applied at longer odds, which produces worse absolute ROI even at similar relative accuracy.
What Last-5 Form Does and Doesn't Tell You
Last-5 form is a signal aggregator. It reflects recent results but not the context behind them. Two teams can both have 10 points from 5 matches while having played completely different opposition, with completely different injury profiles, in completely different tactical circumstances.
The form metric is the same for both teams. The bookmaker's implied probability adjusts for the form and for everything else they know about the match. Your estimate of the two teams should also incorporate the context, and if your contextual assessment diverges meaningfully from the odds, that divergence is where potential value lies. The form number alone is already priced.
Specific contexts where last-5 form has genuine input value:
The form metric is most useful when it diverges from structural baseline expectation. A team averaging 1.2 PPG over the full season with 10 points from last 5 is likely experiencing positive variance, the form is real but probably overstating current quality. A team with a 1.9 PPG full-season average currently showing 4 points from 5 may be underpriced if the poor spell reflects a specific, short-term disruption rather than structural decline.
The team pages on this site show form across multiple time windows, allowing you to assess whether current form is consistent with longer-term performance or represents a departure from it. That context is the layer that sits on top of the form number and may not be fully captured in the odds.
Comparison with Streak-Based Analysis
Last-5 points and consecutive win/loss streaks measure similar but different things. A team with 15 points from 5 matches has won all five, they are also on a 5-game winning streak. But a team with 9 points from 5 matches could be on a 3-game winning streak (W/W/W/L/L) or a 2-game winning streak (L/L/L/W/W). The last-5 points total doesn't capture the recency weighting of a streak.
The streak-based analysis in our winning streaks article reaches the same conclusion through a different lens: the market prices both the total points and the momentum signal with consistent accuracy.
Summary
Last-5 match form predicts football results clearly and consistently. The 21-percentage-point gap in win rates between poor-form and excellent-form teams is real, large, and stable across 360,000 observations.
It does not create a betting edge because the market adjusts odds for form at the same rate. The gap between actual win rate and implied probability is approximately +6%, the bookmaker's margin across every form band. Backing teams in good form or against teams in poor form produces the same ROI as any other level-stakes selection approach.
Final thought: Check form, but ask what it means beyond the numbers. The number itself is already in the price. What the bookmaker cannot price is your assessment of why the form looks the way it does, and whether the next match context is likely to maintain or reverse it.
Data: 360,000+ team-match observations requiring a full 5-game prior window, 22 leagues, 2000–2026. Points from last 5 matches calculated within season, resetting at season boundaries. Best available odds: Max → Average.
Related articles
Does the market overreact to recent form? (Pillar)
The full analysis across form bands, streaks, and eras: Does Form Matter in Football Betting.
Are teams on winning streaks overpriced?
Streak-by-streak ROI and the home/away split: Are Winning Streaks Overpriced.