The short answer is no. Backing all pre-match favourites across our database of 182,247 matches returns −4.15% ROI. Every pound staked returns 95.85p on average. The bookmaker margin does its job.
But that headline figure hides something more specific, and it is the thing worth understanding.
The data splits favourites into two distinct categories, home favourites and away favourites, and they have behaved differently over 25 years of football results, with the gap widening in a direction most betting analysis hasn't noticed. The era trend is where the real story is.
Key finding: Home favourites return −4.67% ROI overall. Away favourites return −2.62%. In the current era (2021–2026), backing away favourites has produced +0.57% ROI across 11,941 matches. The market has been consistently underpricing away favourites in recent seasons.
The Headline: Favourites Lose
Across 182,247 matches with valid odds data from 22 leagues between 2000 and 2026, the results are unambiguous:
| Metric | Figure |
|---|---|
| Matches tested | 182,247 |
| Favourite win rate | 49.93% |
| Average favourite odds | 2.01 |
| Overall ROI | −4.15% |
| Implied win probability | 49.74% |
| Actual vs implied gap | +0.19% |
Favourites win almost exactly as often as the odds imply, the market prices them accurately on average. The loss comes from the bookmaker's margin, not from favourites being systematically overrated. The implied win probability of 49.74% versus the actual win rate of 49.93% shows favourites are actually very slightly underpriced overall, but the margin absorbs that and more.
This is consistent with the academic favourite-longshot bias literature: backing favourites loses less than backing underdogs, but it still loses.
The Split That Matters

The aggregate −4.15% figure combines two very different populations:
| Type | Matches | Win rate | Avg odds | ROI |
|---|---|---|---|---|
| Home favourite | 136,582 | 50.60% | 1.98 | −4.67% |
| Away favourite | 45,665 | 47.93% | 2.12 | −2.62% |
Away favourites produce meaningfully better returns despite a lower win rate. The reason is odds: away favourites average 2.12 versus 1.98 for home favourites. The market prices away favourites at slightly longer odds than their actual performance warrants, they win at 47.93% while the implied probability from their average odds is 47.26%. That +0.67 percentage point gap outperforms the home favourite equivalent, where actual (50.60%) nearly exactly matches implied (50.63%), a gap of just −0.03 points.
The Era Trend: A Story of Market Efficiency
The era breakdown is where this data is different from any competitor analysis.
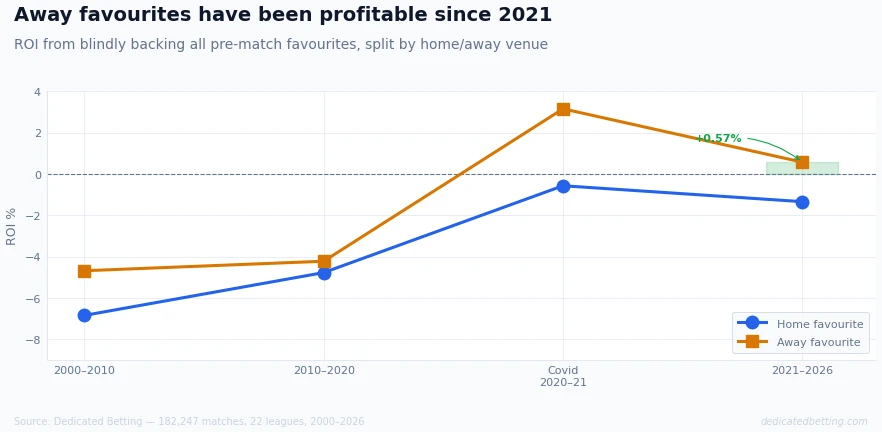
| Era | Home fav ROI | Away fav ROI |
|---|---|---|
| 2000–2010 | −6.84% | −4.68% |
| 2010–2020 | −4.77% | −4.22% |
| Covid 2020–21 | −0.57% | +3.15% |
| 2021–2026 | −1.34% | +0.57% |
Two things are visible. First, both categories have improved dramatically toward breakeven, home favourites from −6.84% to −1.34%, away favourites from −4.68% to +0.57%. This mirrors the broader market efficiency trend we identified in our football betting strategy pillar article: bookmakers have priced category-level patterns far more accurately over the past 25 years.
Second, the gap between home and away favourites persists, and away favourites have crossed into positive territory. In the Covid season (2020–21), crowd absence removed the structural home advantage that bookmakers had historically priced in, and away favourites produced +3.15% ROI. What's notable is that the positive away favourite performance has largely continued post-Covid, +0.57% across 11,941 matches from 2021 to 2026.
Important caveat: 11,941 matches is substantial, but betting ROI has high variance. A +0.57% figure over this sample could represent a genuine, persistent market inefficiency, the market continuing to overprice home advantage, or it could be noise that reverts. The actual vs implied gap of +2.31 percentage points for away favourites in this era suggests systematic underpricing rather than random variance, but we state this as an observed pattern, not a reliable forward strategy.
Which Odds Ranges Lose the Least

| Odds band | Matches | Win rate | ROI | Actual vs implied |
|---|---|---|---|---|
| Under 1.30 | 7,680 | 82.90% | −0.36% | −0.11 |
| 1.30–1.50 | 12,247 | 71.09% | −1.22% | −0.77 |
| 1.50–1.75 | 30,136 | 59.49% | −3.52% | −2.04 |
| 1.75–2.00 | 31,490 | 51.33% | −4.75% | −2.50 |
| 2.00–2.50 | 75,453 | 43.18% | −4.73% | −1.97 |
| 2.50–3.00 | 25,160 | 36.70% | −4.97% | −1.89 |
| 3.00+ | 81* | 24.69% | −20.75% | −5.78 |
The pattern is clear: the shorter the odds, the smaller the loss. Sub-1.30 favourites return −0.36%, the closest to breakeven in the dataset. The 1.30–1.50 band returns −1.22%. Once you move into the 1.50–2.50 range you are consistently losing 3.5–5%.
This confirms the favourite-longshot bias in football: very short-priced selections are priced more accurately than longer-priced ones. The market is better at pricing near-certainties than it is at pricing tight contests.
The practical implication is limited, you cannot build a profitable strategy around sub-1.30 favourites alone. The sample size is 7,680 matches but many of these involve extreme mismatches where even a small selection error (injuries, rotation) creates significant loss. The −0.36% figure is close to breakeven, but the bookmaker margin still wins.
*The 3.00+ band contains only 81 matches. Treat as indicative only, the extreme loss figure reflects small sample size and unusual circumstances, not a reliable pattern.
League Variation: Where the Split Is Most Pronounced

The league breakdown reveals where the away favourite premium is most pronounced, and where it disappears.
Leagues where away favourites outperform home favourites:
Serie A is the standout. Away favourites have returned +3.54% ROI over the full dataset, compared to −3.31% for home favourites, a gap of 6.85 percentage points. This is the largest away favourite premium in our data. Ligue 1 (+1.07%) and Primeira Liga (+0.74%) also show positive away favourite returns.
Leagues where home favourites outperform (counter-intuitive):
The Premier League and La Liga, two of the most-bet leagues in the world, show the opposite pattern. In the Premier League, home favourites return −1.62% versus −3.25% for away favourites. In La Liga, home favourites return −1.68% versus −2.84% away. The market in these leagues prices home advantage more efficiently, or perhaps underprices it, the result is that the home favourite is closer to fair value than the away favourite.
This matters for how you interpret the overall away favourite trend. The positive 2021–2026 away favourite figure is an aggregate across 22 leagues. In the two highest-volume, most-followed leagues, the pattern runs in reverse.
What This Means for Football Betting
None of this constitutes a betting system. The −4.15% overall figure is the ground truth: backing all favourites loses. The home/away split and era trend tell you where losses are concentrated and where the market has been less accurate, but identifying a pattern in historical data is not the same as having a forward edge.
The data is useful as a calibration tool. If you are assessing a match where the away team is a clear favourite, the historical context, that the market has recently been underpricing away favourites, is a relevant input to a probability estimate. It does not replace the estimate; it informs the baseline you start from.
For the Premier League and La Liga specifically, the historical data suggests the market prices home advantage more accurately than in other leagues. That is a reason for slightly less confidence in away favourite value claims in those competitions, not a reason to dismiss them.
The value betting framework covers the mechanics of converting this kind of context into an actual probability estimate and bet decision. The team pages on this site show current-season home and away form for every team in 22 leagues, the structural data that feeds that estimation process.
What Standard Favourite Analysis Misses
A lot of favourite-betting analysis stops at the headline number: back every favourite, calculate the average return, then conclude that favourites lose money overall. That is useful, but it only tells part of the story.
The more interesting question is where those losses come from. Are home favourites and away favourites priced in the same way? Has that changed over time? Do certain leagues, eras or price ranges behave differently? Those splits matter because the favourite category is not one single market.
Our analysis separates favourites by home and away status, then looks at how those returns have changed across different periods. That is where the practical insight appears. The data suggests the market today is not behaving exactly as it did in 2005, and away favourites in particular may deserve a different interpretation from the broad “favourites lose” headline.
Using Dedicated Betting Data for Favourite Analysis
The site data is built around exactly the questions this article raises: which teams genuinely outperform as home or away favourites, and which leagues carry structural patterns worth knowing?
-
League pages show current-season home advantage data for all 22 competitions - home win percentage, goals per game, and home PPG for the current season. Before assessing a favourite in an unfamiliar league, checking whether that competition currently shows strong or weak home advantage is the right starting point. A league where home advantage has nearly disappeared changes the baseline for any home favourite estimate.
-
Team pages show current-season Home vs Away Form for every team: home PPG, away PPG, win rate splits, and goals data. This is the specific data that matters for a favourite assessment. A team priced as a home favourite at 1.80 that averages 2.3 PPG at home but only 0.9 PPG away has a structural home strength significantly above average - relevant information when the implied probability is 55.6%. The same team priced as an away favourite at 2.00 requires a different assessment entirely.
-
Head-to-head pages show the last five meetings between any two teams in the database, including venue and result. For specific matchups where one team has a strong historical record regardless of venue, the H2H context complements the home/away split data.
-
Best Home Teams rankings cover all 22 leagues with time windows down to the last 10 matches. The multi-window view matters here: a team that ranks highly all-time but has declined recently is a different proposition from one whose home strength is improving. Both are relevant to how much weight you place on the home advantage component of a probability estimate.
The value betting framework covers how to convert this kind of contextual data into an actual probability estimate and bet assessment. The site data provides the structural inputs — the judgement about whether current odds reflect those inputs accurately is the part no data source can do for you.
Summary
Backing all favourites returns −4.15% ROI across 182,247 matches. The loss is real and consistent. But the average combines two distinct populations: home favourites at −4.67% and away favourites at −2.62%, with away favourites producing +0.57% in the current era.
The data points in a consistent direction across multiple leagues and time periods: the market is better at pricing home favourites accurately than away favourites, and that gap has been most pronounced since 2021. Whether this persists, and by how much, requires ongoing monitoring rather than a static conclusion.
Final thought: Favourites overall lose. But within that, away favourites have been meaningfully less unprofitable, and recently profitable, in a pattern consistent enough across 11,941 matches and multiple leagues to be worth understanding. It is not a strategy. It is a baseline.
All figures taken from the Dedicated Betting database: 182,247 matches with valid odds data across 22 divisions, 2000–2026. Favourite defined as the team with the lowest best-available pre-match win odds (Max → Average → B365 cascade). Home team wins ties. Era boundaries: 2000–2010 (59,303 matches), 2010–2020 (76,225 matches), 2020–21 Covid season (8,192 matches), 2021–2026 (38,527 matches). Best available odds methodology produces higher ROI figures than single-bookmaker analyses; direct comparison with 1xBet closing price studies should account for this.
Related articles
Football betting strategy: selection systems across 22 leagues
The full analysis of what simple selection systems, favourites, home teams, draws, underdogs, actually return across 182,000 matches, including the era-by-era efficiency trend: Football Betting Strategy.
Do staking systems fix a losing approach?
Why Martingale, Fibonacci and percentage staking cannot turn a negative expected value into profit, tested with real historical parameters: Football Betting Systems.
Which teams have the strongest home advantage?
All-time and recent home PPG rankings for every team in 22 leagues, with time windows down to the last 10 matches: Football Teams With the Strongest Home Advantage.