The contrarian argument is one of the most persistent ideas in football betting: when a team is on a losing streak, bookmakers and the public overreact, pushing prices too long. Backing the losing team represents value precisely because the market has become too pessimistic.
The logic is appealing and not entirely implausible, sentiment can affect prices, and overreaction to recent results is a documented behavioural bias. The question is whether it produces an exploitable edge in football betting markets.
We tested it across 370,000+ team-match observations from 22 leagues. The data does not support the contrarian theory.
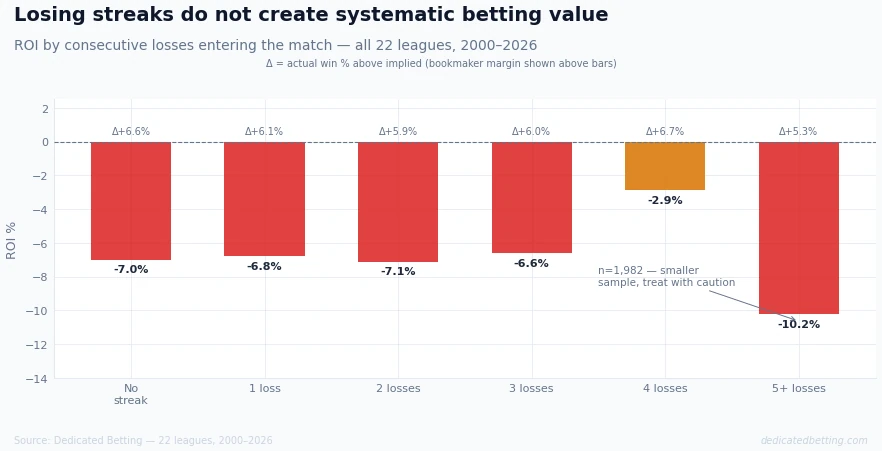
Key finding: Backing teams on consecutive losing streaks at any length produces negative ROI. The actual win rate above implied probability stays flat at approximately +6% across all streak lengths, the bookmaker margin, applied consistently. The market prices losing streaks accurately.
The Contrarian Theory and Why It Might Work
Before the data: the theory has some basis. In efficient markets, prices should reflect all available information. But markets are made by people (and algorithms trained on past market behaviour), and people are susceptible to availability bias, recent results are more salient than base rate probabilities. If the public backs teams in good form and avoids teams in poor form, prices could be pushed to over-short the in-form team and over-lengthen the out-of-form team.
Football betting markets are not perfectly efficient. Our era analysis shows the overall market margin has varied significantly over time, and individual leagues and markets show pricing patterns that differ from the average. The possibility of overreaction to losing streaks is not inherently implausible.
The data measures it directly.
What the Data Shows
| Loss streak | Matches | Win rate | Avg odds | ROI | Actual vs implied |
|---|---|---|---|---|---|
| No streak | 225,056 | 37.8% | 3.21 | −7.0% | +6.6% |
| 1 loss | 81,044 | 36.8% | 3.26 | −6.8% | +6.1% |
| 2 losses | 29,054 | 32.6% | 3.74 | −7.1% | +5.9% |
| 3 losses | 11,401 | 31.6% | 3.92 | −6.6% | +6.0% |
| 4 losses | 4,679 | 30.0% | 4.28 | −2.9% | +6.7% |
| 5+ losses* | 1,982 | 27.1% | 4.58 | −10.2% | +5.3% |
Win rates fall as streak length increases, from 37.8% for teams with no losing streak to 27.1% for teams on 5+ consecutive losses. Odds lengthen to match: average odds move from 3.21 to 4.58. The actual-vs-implied gap stays between 5.3% and 6.7% throughout.
The best ROI in the table is the 4-loss category at −2.9%. This is the least negative figure, and it does stand out slightly from the surrounding categories. But it is still negative, and the sample of 4,679 matches, while meaningful, is not large enough to conclude that this represents a genuine pricing anomaly rather than variance around the −6% to −7% mean.
The 5+ losses category returns −10.2% ROI. This directly contradicts the contrarian theory: the longest losing streaks are the worst-returning category in the table, not the best. The market may not overreact to losing streaks; if anything, the data suggests the opposite, teams in extended poor form are harder to back profitably at the odds available.
*Beyond 5 consecutive losses, sample sizes fall sharply (918 matches for 6 losses, 435 for 7, 193 for 8, 107 for 9). Individual data points at these lengths are unreliable and excluded from the main analysis.
Home vs Away Split
The home/away breakdown adds one relevant nuance. Teams on losing streaks split into two very different populations: teams that are losing while playing at home (structural underperformance) and teams that are losing while playing away (which may be more expected for weaker sides).
| Loss streak | Home ROI | Away ROI |
|---|---|---|
| No streak | −5.0% | −8.7% |
| 1 loss | −5.6% | −8.6% |
| 2 losses | −6.2% | −8.0% |
| 3 losses | −3.5% | −10.7% |
| 4 losses | −3.5% | −2.1% |
| 5+ losses | −5.1% | −16.0% |
Home teams on 3-4 consecutive losses return −3.5% - in line with the general finding that the home venue provides a floor that the market doesn't always fully price when teams are in poor form. Away teams on 5+ losses return −16.0% - a terrible result from a small sample, but directionally consistent with the aggregate.
There is no category in this table where the contrarian theory holds as a reliable edge. The closest is home teams on 3–4 consecutive losses at −3.5%, where the home advantage floor may provide some cushion, but again, still negative.
Era Analysis: Has the Market Always Priced Losing Streaks This Way?
| Era | No streak ROI | 4+ losses ROI | Gap (no streak) | Gap (4+ losses) |
|---|---|---|---|---|
| 2000–2010 | −10.7% | −10.3% | +4.5% | +5.2% |
| 2010–2020 | −6.2% | −2.1% | +7.2% | +7.0% |
| 2020–21 Covid | −1.9% | −9.1% | +7.8% | +5.0% |
| 2021–2026 | −3.8% | −10.6% | +8.5% | +6.2% |
In the 2010–2020 era, backing teams on 4+ consecutive losses returned −2.1% - the closest to breakeven in the era breakdown. This is consistent with the aggregate finding that the 4-loss category is somewhat less negative than others, but it was still negative and it has deteriorated in the current era (−10.6%).
There is no era in which the contrarian theory produced systematic positive returns from backing teams on losing streaks.
When Losing Streaks Are Worth Examining
The data does not mean losing streaks are irrelevant to betting analysis. It means the streak alone, as a mechanical selection criterion, doesn't create an edge. The bookmaker's extended odds already reflect the team's poor form.
What losing streaks can tell you is that something may be wrong. A team on a 4-game losing run is likely dealing with injuries, poor form, a managerial change, fixture congestion, or some combination. Understanding which of these applies, and whether the specific next fixture changes the prognosis, is the analysis that adds value beyond the streak itself.
A team on a 4-game losing run that has just regained their first-choice striker, faces a weaker opponent at home, and has had a full week of preparation is a very different proposition from a team in the same statistical position facing a stronger side away from home mid-week. The bookmaker prices both teams at similar odds because the form record is similar. Your probability estimate should differ because the context is different.
The team pages show current-season injury context, home vs away form splits, and opponent quality, the contextual data that sits behind the streak number. The H2H pages show historical head-to-head patterns between the two teams, which can be relevant when a losing streak coincides with a favourable historical fixture.
Summary
Backing teams on consecutive losing streaks produces negative ROI at every streak length tested across 370,000+ observations. The actual-vs-implied gap stays flat at approximately +6%, the bookmaker margin, regardless of how many consecutive losses a team has accumulated. The contrarian theory, as a mechanical betting approach, is not supported by the data.
The 4-loss category returns −2.9%, the least negative in the dataset, and home teams on 3–4 consecutive losses show some tendency toward less negative returns. Neither represents a reliable edge.
Final thought: Losing streaks create opportunities for analysis, not automatic value. The odds are already longer. The question is whether they are long enough* given the specific context of the next fixture, and that requires assessment beyond the streak count.
Data: 370,000+ team-match observations excluding first match of each season, 22 leagues, 2000–2026. Streak defined within division, reset at season boundary. Figures beyond 5 consecutive losses omitted due to small samples. Best available odds: Max → Average
Related articles
Are winning streaks overpriced by bookmakers?
The mirror analysis for teams on winning runs, streak-by-streak ROI and the home/away split: Are Winning Streaks Overpriced.
Does form matter in football betting? (Pillar)
The full market efficiency analysis across form bands, streaks, and eras: Does Form Matter in Football Betting.