Most football betting strategies fail for the same reason: the bookmaker has already thought of them.
Backing favourites, backing home teams, backing draws, backing underdogs - every category-level approach has been modelled, priced and margined into the odds before you place a single bet. The question is not whether these approaches can be made to work occasionally. It is whether any of them produce positive returns at scale, and whether the data gives us any indication of where genuine edges might exist.
We tested 182,112 football matches across 22 leagues and 24 seasons. Here is what the data actually shows.
Key takeaway: No simple category-level strategy produces consistent long-run profits. The market prices favourites, home teams, underdogs and draws efficiently enough to extract its margin from every approach. But the picture varies - by odds band, by league, by era - and understanding that variation is the foundation of any serious analytical framework.
The Four Simple Strategies: What They Actually Return
The most common football betting approaches are straightforward to test. Back every home team. Back every pre-match favourite. Back every underdog. Back the draw. Run each strategy at level stakes across 182,112 matches with valid odds data.
| Strategy | Matches | Win rate | Avg odds | ROI |
|---|---|---|---|---|
| Back all favourites | 182,112 | 49.9% | 2.01 | −4.2% |
| Back all home teams | 182,112 | 44.4% | 2.51 | −5.4% |
| Back all draws | 182,112 | 26.6% | 3.68 | −6.17% |
| Back all underdogs | 182,112 | 23.5% | 4.63 | −9.8% |
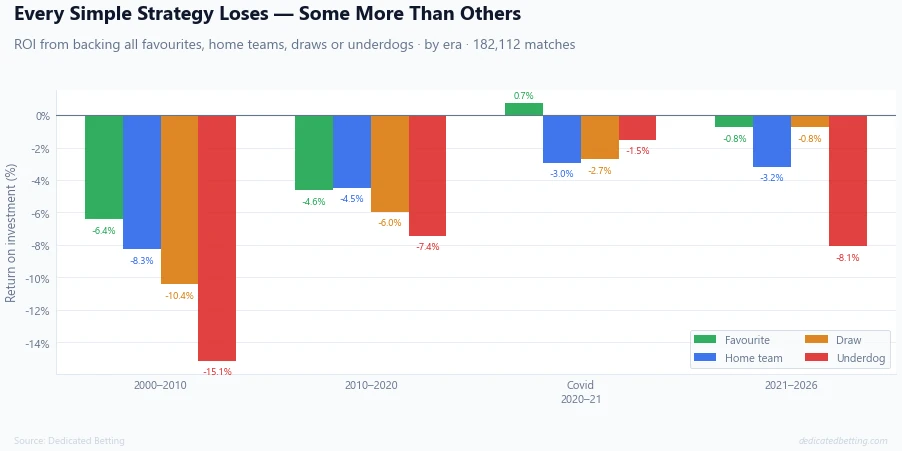
Every strategy loses. Favourites are the least bad at −4.2%. Underdogs are the worst at −9.8% - a loss rate that compounds into near-total bankroll destruction over any meaningful sample.
A few things are worth noting in this table before we go further.
The favourite's 49.9% win rate is almost exactly equal odds - a coin flip. But the average odds of 2.01 means you need 49.8% to break even, so the 50.0% actual win rate is beating implied probability. Yet you still lose 4.16% on every bet. This is the bookmaker's margin doing its work even when you are picking correctly.
The underdog's −9.8% ROI is not because underdogs never win - they win 23.5% of the time. It is because the odds are set at an average of 4.63, implying a 21.6% win probability. Underdogs are overpriced relative to their actual performance. You are systematically paying too much for the excitement of the upset.
The home team's −5.4% is notable for being worse than the favourite's −4.2%, even though home teams and favourites heavily overlap. This tells you that among non-home-team favourites - away favourites - performance is strong enough to drag the overall favourite ROI below the home-only figure. Away favourites are priced more efficiently than home favourites.
How the Odds Band Defines Your Results
The single most important finding in our dataset is not about strategy categories, it is about price ranges.
| Odds band | Matches | Actual win % | Implied win % | Gap | ROI |
|---|---|---|---|---|---|
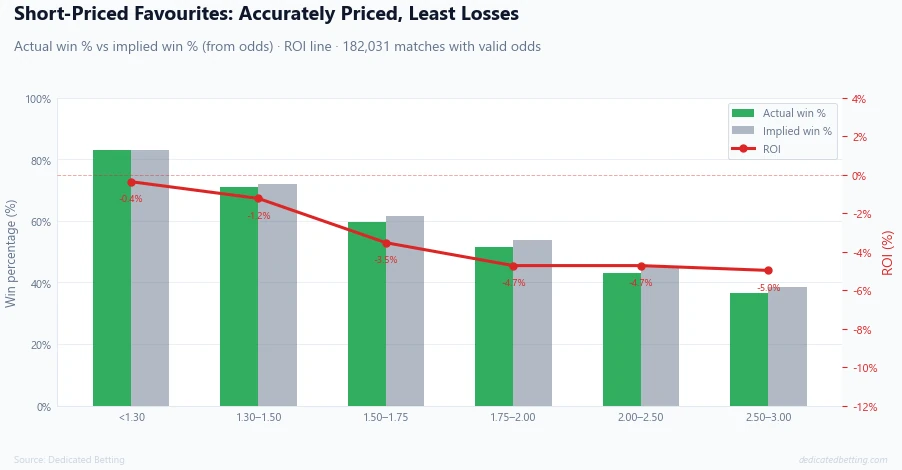
| Under 1.30 | 7,674 | 82.9% | 83.0% | −0.11% | −0.37% |
| 1.30–1.50 | 12,235 | 71.1% | 71.9% | −0.79% | −1.24% |
| 1.50–1.75 | 30,106 | 59.5% | 61.5% | −2.05% | −3.54% |
| 1.75–2.00 | 31,473 | 51.3% | 53.8% | −2.48% | −4.73% |
| 2.00–2.50 | 75,402 | 43.2% | 45.1% | −1.97% | −4.73% |
| 2.50–3.00 | 25,141 | 36.7% | 38.6% | −1.89% | −4.98% |
The pattern is striking. The shortest-priced favourites (teams priced under 1.30) win exactly as often as their odds predict. The gap between actual win rate and implied win rate is just −0.11% across 7,674 matches. The ROI is −0.37%, the tightest of any band.
As odds lengthen, the gap widens. Teams priced in the 1.75–2.00 range win 2.48 percentage points less often than their odds imply. This is the most mispriced segment in the database - the market overestimates the win probability of modest favourites more than any other price range.
This is a well-documented phenomenon in betting research, sometimes called the favourite-longshot bias. In football, the data supports a specific version of it: the market is most accurate at extreme prices (near-certainties and long shots) and least accurate in the middle ground where matches appear competitive but one team is still a meaningful favourite.
The practical implication is not that you should blindly back short-priced favourites, the ROI is still negative. It is that if you are evaluating the price of a 1.80 favourite against your own assessment of their actual win probability, you should have a particularly strong reason to believe the market is wrong before backing them. The data says the market systematically overestimates these teams.
Why No Strategy Has a Permanent Edge
The era breakdown reveals something important about how betting markets have evolved.
| Era | Matches | Favourite win % | Avg odds | ROI | Actual vs implied |
|---|---|---|---|---|---|
| 2000–2010 | 59,303 | 49.7% | 1.963 | −6.4% | −1.27% |
| 2010–2020 | 76,225 | 49.8% | 2.012 | −4.6% | +0.04% |
| Covid 2020–21 | 8,192 | 50.0% | 2.114 | +0.7% | +2.68% |
| 2021–2026 | 38,392 | 50.7% | 2.059 | −0.8% | +2.08% |
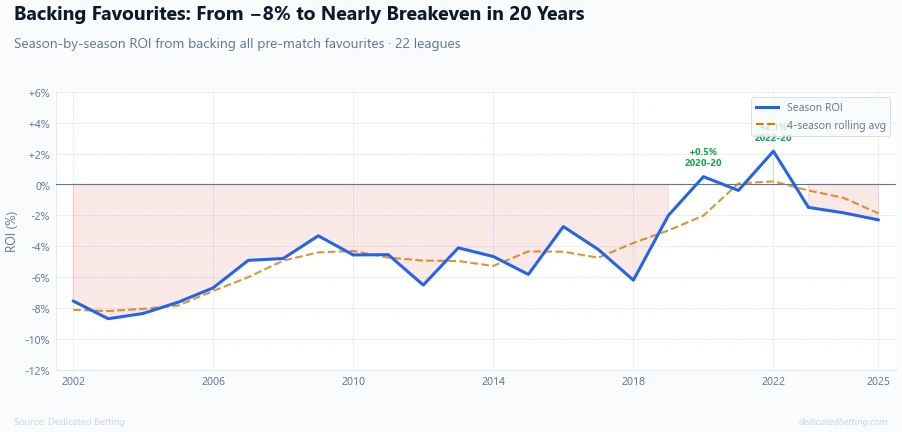
In the 2000s, blindly backing all favourites produced a loss of −6.4% per bet. In the current era, the same approach produces −0.8%. The improvement is not because favourites are winning more often, the win rate barely changed. It is because the odds have drifted out as the market became more efficient. Average favourite odds rose from 1.96 in the 2000s to 2.06 today, meaning bookmakers are pricing the expected winner less aggressively than they used to.
Two seasons produced genuinely positive returns from backing all favourites: 2022–23 at +2.15% and 2020–21 (Covid) at +0.74%. These are not evidence that the strategy works - they are evidence of the variance around a long-run mean. Across 24 seasons, only two were profitable.
The era trend matters for a specific practical reason: strategies developed using historical data from the 2000s are calibrated to a market that no longer exists. A system showing a 2% edge in backtesting using pre-2010 data is not evidence of a current edge - it is evidence of how much more efficient markets have become.
The League Dimension: Where Favourites Lose Most
Favourite ROI varies considerably across competitions, and the pattern does not follow what most bettors expect.
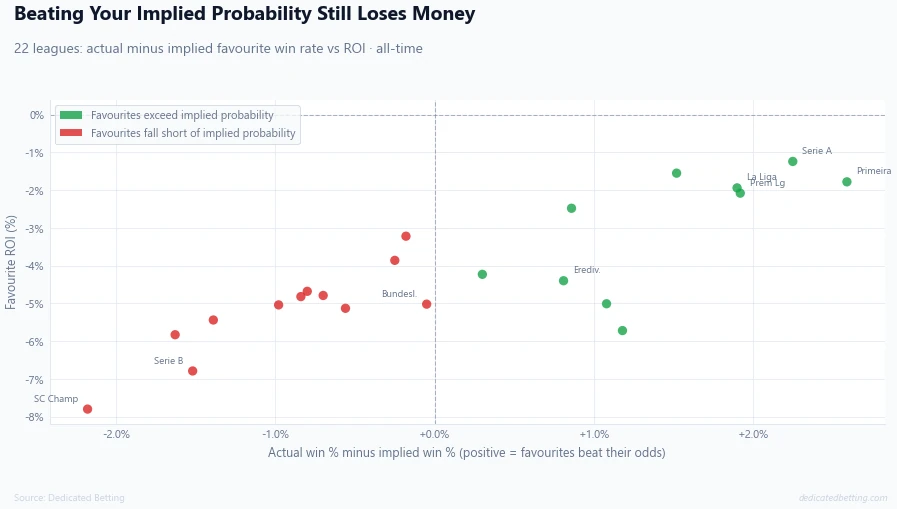
The top five leagues for favourite ROI are Serie A (−1.24%), Super Lig (−1.55%), Primeira (−1.78%), La Liga (−1.94%) and the Premier League (−2.08%). The worst is the Scottish Championship at −7.80%.
But the more revealing column is actual vs implied win percentage. In ten of 22 leagues, favourites win more often than their odds predict. Primeira (+2.59%), Serie A (+2.25%), Premier League (+1.92%) and La Liga (+1.90%) all show favourites outperforming their implied probability. Yet every single one of these leagues still produces a negative ROI.
This is the clearest demonstration in our database of why finding a team that wins more than expected is not sufficient. The bookmaker's margin sits between your edge and your profit. Even a genuine outperformance of 2% relative to implied probability leaves you losing money if the margin exceeds that gap.
In the lower leagues - Scottish Championship (−2.18%), League Two (−1.63%), Serie B (−1.52%) - favourites actually win less often than their odds imply. These markets are less efficiently priced, but in the wrong direction for those backing favourites. The odds overestimate favourites in these competitions, and you pay the full price for it.
What This Tells Us About Football Betting Strategy
The data produces five findings that any honest betting framework has to accommodate.
The market is efficient enough to extract its margin from every simple approach. Home teams, favourites, underdogs and draws all lose at rates consistent with the bookmaker margin being fully applied. There is no free category to back.
Short-priced favourites are priced most accurately. Sub-1.30 favourites win almost exactly as often as their odds imply. This means systematic over or underpricing is least likely to exist here. Conversely, favourites in the 1.75–2.00 range are where the market most consistently overestimates the expected winner - the largest gap between actual and implied performance in the entire dataset.
The market has become substantially more efficient over time. The favourite ROI improved from −6.43% (2000s) to −0.75% (current era). Any strategy built on historical data needs to account for this shift. An edge that existed in 2005 may have been arbitraged away by 2015.
League context matters. Favourite ROI ranges from −1.24% (Serie A) to −7.80% (Scottish Championship). These are not random variations - they reflect genuine differences in market depth, data quality and bookmaker resource allocation across competitions. A strategy that appears to work in one league may perform differently in another.
Beating implied probability does not guarantee profit. Ten leagues show favourites outperforming their implied win rate, yet all ten still produce negative ROI. The margin absorbs the edge. For a strategy to be genuinely profitable, the edge in pricing has to exceed the margin embedded in the odds - which is typically 3–8% in modern football betting markets.
Where Genuine Edge Can Exist
None of the above means football betting is impossible to profit from. It means the route to positive returns is specific rather than categorical.
The historical data shows narrow windows where efficiency has lagged. The 2010–2020 era produced better returns than the 2000s precisely because the market was slow to price in the declining home advantage trend - odds on away teams didn't fully reflect how much more competitive away performances had become. By the time the market caught up, the lag had closed.
Understanding where the market is currently mispricing requires current data, not historical patterns. Our league pages show live home vs away performance and betting market context for each competition - the equivalent of checking whether the current season's actual data is tracking the implied probabilities or diverging from them. When a specific league or specific team type is consistently outperforming its implied probability in live data, that is when the framework developed here becomes practically useful.
Team-level analysis adds further precision. Our team pages show current season Home vs Away Form - home PPG vs away PPG, win rate splits - which tells you whether a specific club is performing significantly above or below what their recent odds have implied. Our Best Home Teams ranking covers all 22 leagues with time windows down to the last 10 matches, useful for identifying teams currently showing strong deviation from their implied performance.
The underlying principle is consistent with what the data shows: the edge, when it exists, comes from identifying specific situations where actual performance is diverging from what the odds imply - not from picking a category and backing it systematically.
A Note on Responsible Betting
The data in this article documents what the historical evidence shows about category-level strategies. It does not provide a guaranteed path to profit, because no such path exists. Football betting involves genuine risk of financial loss, and even well-researched approaches can and do lose money over meaningful sample sizes.
Our Responsible Gambling section covers staking principles, loss limits, and realistic expectations for anyone approaching football betting analytically. The bankroll management principles in our Bankroll Management guide are as relevant to data-driven betting as to any other approach - perhaps more so, because analytical methods can create false confidence in the reliability of an edge.
Summary
Across 182,112 matches and 24 seasons, no simple football betting strategy produces consistent long-run profits. Favourites lose 4.2% per bet, home teams 5.4%, draws 6.2%, underdogs 9.8%.
The odds band analysis is the most practically useful finding: sub-1.30 favourites are priced with near-perfect accuracy (−0.1% gap between actual and implied win rate), while favourites in the 1.75–2.00 range are systematically overestimated by the market (−2.5% gap). The market is most wrong at intermediate prices.
The market has become dramatically more efficient over 25 years. What lost 6% in the 2000s loses less than 1% today. Historical backtesting on pre-2015 data tells you about a market that no longer exists.
In 10 of 22 leagues, favourites win more often than their odds imply. They still lose money in all 10. The margin absorbs the edge. This is the central lesson: finding an edge is not enough - the edge has to exceed the margin, and that requires precision about which team, in which competition, at which price, right now.
Final thought: Simple football betting strategies lose money consistently. The data identifies where pricing is most and least accurate, and how market efficiency has evolved. Consistent profit requires identifying specific situations where actual performance diverges from implied probability, not backing a category and hoping.
All statistics drawn from the Dedicated Betting database, covering 182,112 matches with valid odds data across 22 football divisions from 2002–03 to 2025–26. Best available odds used throughout (Max → Average).
Related football articles
Does home advantage still matter in football?
This article looks at home advantage by league. Our main guide examines the broader picture - how home advantage has declined across all 22 leagues over 33 seasons, why it exists, and what it means for the betting markets. Read the full Home Advantage in Football analysis.
Which leagues have the biggest home advantage?
The crowd effect is one reason why home advantage varies so much between competitions. Our League Comparison article ranks all 22 leagues and shows how the rankings have shifted over 30 years.
Bankroll Management - Don't skip this!
Good bankroll management is what keeps you alive through variance. It’s often the difference between a winning season and a losing one. Our Football Betting Bankroll Management guide breaks down how smart strategy, disciplined staking, and proper risk control can transform your long‑term results.