Most football bettors think about betting as picking winners. Find the team most likely to win, back them, collect your winnings. The problem with this approach is that the bookmaker has already done the same analysis. They have priced the likely winner at odds that reflect their win probability, and added a margin on top.
A value bettor thinks differently. The question is not "who will win?" but "is this price wrong?" A team priced at 2.00 may genuinely have a 50% chance of winning, in which case there is no edge. Or they may have a 56% chance of winning, in which case the price is materially wrong and backing them at 2.00 produces a long-run profit.
Finding situations where the price is wrong, not just where one team is more likely to win, is what value betting actually means.
Key takeaway: Value betting requires a more accurate probability estimate than the bookmaker, not just correct predictions. The football market prices most outcomes efficiently, but our data identifies specific odds bands and leagues where systematic mispricing has historically existed.
How Odds Translate to Probability
Before you can identify a mispriced bet, you need to understand what odds are actually saying.
Decimal odds are an implied probability expressed as a return. A team at 2.00 implies a 50% chance of winning - because 1 divided by 2.00 equals 0.50. A team at 1.50 implies a 66.7% chance. A team at 4.00 implies a 25% chance.
This calculation - implied probability = 1 ÷ decimal odds - is the foundation of value betting. Once you think in probabilities rather than outcomes, the concept of a mispriced bet becomes concrete.
The bookmaker's margin works by making the implied probabilities sum to more than 100%. In a three-outcome football match, the implied probabilities of home win, draw and away win will typically add to 106–110%. That excess, known as the overround, is the bookmaker's guaranteed margin across their book.
A coin toss illustrates the concept cleanly. A fair coin lands heads 50% of the time. Fair odds are 2.00. If a bookmaker offers 1.90 on heads, the implied probability is 52.6% - but the true probability is 50%. You are systematically overpaying. Over thousands of bets, you lose approximately 5% of every pound staked.
Now reverse it: if someone offers you 2.15 on heads, the implied probability is only 46.5% but the true probability is 50%. You now have a positive edge of 3.5 percentage points. Over thousands of bets, you profit. This is a value bet.
Football is not a coin toss. The challenge is that nobody knows the true probability of a football outcome with certainty - not you, not the bookmaker. Value betting is about estimating it more accurately than the market, not knowing it with certainty.
What Value Betting Actually Requires
Three things are necessary to be a value bettor in practice.
-
A probability estimate. You need your own assessment of the likelihood of an outcome, not just a feeling that a team will win, but an actual probability. This typically comes from a model, statistical analysis, or sustained specialist knowledge of a specific market. Without a probability estimate, you cannot compare your view to the bookmaker's implied probability.
-
A comparison to the market. Once you have your estimate, you compare it to the implied probability in the odds. If your estimate is higher than the implied probability, you have a potential value bet. If it is lower, you do not.
-
An edge that exceeds the margin. This is where most discussions of value betting stop short. Even if your probability estimate is better than the bookmaker's, it needs to be better by more than the bookmaker's margin, typically 4–8% in football markets. If your estimated edge is 2% and the margin is 5%, you are still losing money on average.
This is why value betting is difficult. The market is efficient enough that consistent edges of 5%+ are rare and hard to sustain as more bettors identify and trade on the same information.
Where the Football Market Gets the Price Wrong
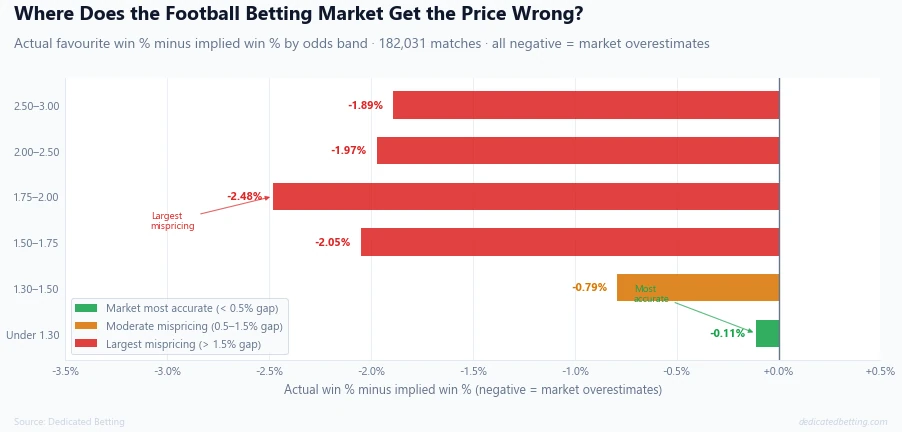
The useful question is not whether mispricing exists in theory, it does, but where it has actually occurred in practice. Our database of 182,031 football matches with odds data gives a specific answer.
The pattern is striking and specific.
-
Sub-1.30 favourites are priced with near-perfect accuracy. Across 7,674 matches, teams at odds below 1.30 won 82.9% of the time. Their odds implied an 83.0% win rate. The gap is just −0.11% - effectively zero. The market is extraordinarily precise at the extreme short end.
-
The 1.75–2.00 band shows the largest mispricing. Across 31,473 matches, teams priced in this range won 51.3% of the time, but their odds implied a 53.8% win rate. The gap is −2.48 percentage points. The market consistently overestimates the win probability of teams in this specific price range more than anywhere else in the dataset.
-
The 1.50–1.75 band is the second worst. A −2.05 percentage point gap across 30,106 matches - the market overestimates these modest favourites too.
This is the favourite-longshot bias applied to football: the market is most accurate at extreme prices and least accurate in the mid-range where matches appear competitive but one team is still a meaningful favourite.
For a value bettor, this data has a specific implication. If you are assessing a team priced between 1.75 and 2.00, the historical base rate suggests the market overestimates them - you would need a strong, specific reason to believe this particular team is an exception before backing them. Conversely, at odds below 1.30, the market's track record suggests near-perfect pricing, making genuine value harder to find.
The critical caveat: even the most mispriced band (1.75–2.00) still produces a negative ROI of −4.73%. Knowing the market overestimates these teams on average does not automatically produce profit - you still need to identify the specific matches where the overestimation is largest, and your edge needs to exceed the bookmaker's margin.
Which Leagues Show the Most Persistent Mispricing
The mispricing pattern is not uniform across competitions. Some leagues consistently show favourites outperforming their implied probability. Others show the opposite.
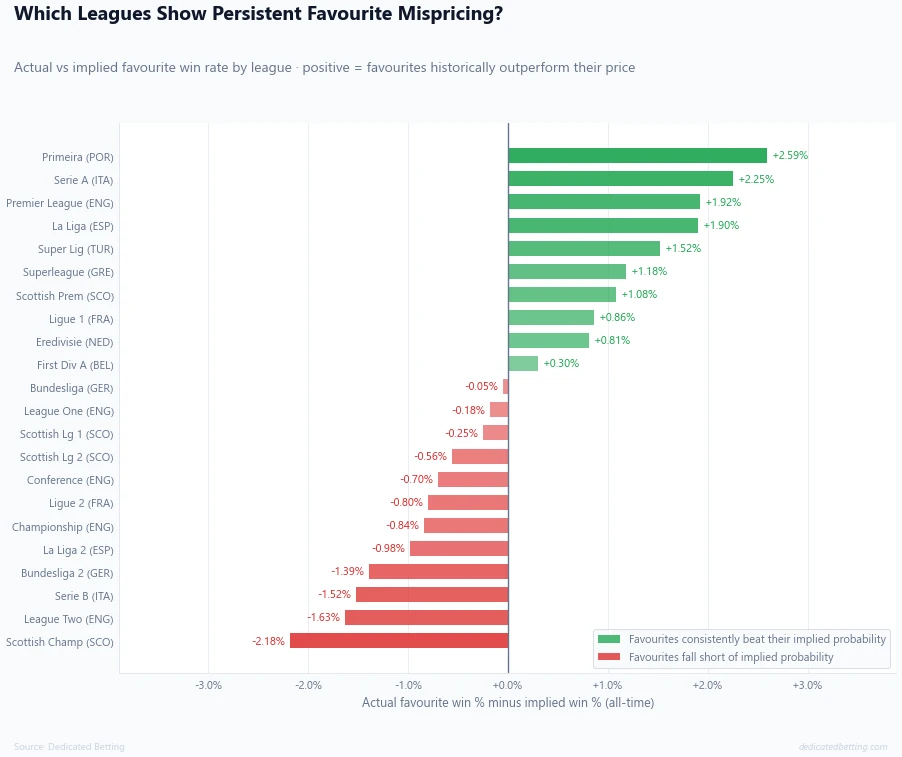
Ten of 22 leagues show favourites consistently winning more often than their odds imply. The Primeira Liga (+2.59%), Serie A (+2.25%), Premier League (+1.92%) and La Liga (+1.90%) show the largest persistent positive gaps.
Twelve leagues show the opposite - favourites win less often than implied. The Scottish Championship (−2.18%), League Two (−1.63%) and Serie B (−1.52%) show the largest negative gaps, meaning the market overestimates favourites in these competitions.
The practical observation for a value bettor: in leagues like the Primeira and Serie A, the bookmaker's implied probability has historically been a consistent underestimate of the favourite's actual win rate. In the Scottish Championship, it has been a consistent overestimate.
The essential caveat, again: in every single one of the ten leagues where favourites beat their implied probability, the ROI from blindly backing all favourites is still negative. Serie A shows the best ROI of any league at −1.24%, despite favourites beating their implied probability by +2.25%. The bookmaker's margin absorbs the edge entirely.
This illustrates the fundamental challenge of value betting in real markets: finding a situation where a team's actual win probability exceeds its implied probability is not enough. The excess needs to be large enough to overcome the margin on that specific bet.
| League | Actual vs implied | ROI (all favourites) |
|---|---|---|
| Primeira Liga | +2.59% | −1.78% |
| Serie A | +2.25% | −1.24% |
| Premier League | +1.92% | −2.08% |
| La Liga | +1.90% | −1.94% |
| Scottish Championship | −2.18% | −7.80% |
| League Two | −1.63% | −5.83% |
| Serie B | −1.52% | −6.79% |
How Market Efficiency Has Changed Over Time
The football betting market appears to have become substantially more efficient over the past 25 years. This matters because strategies and edges visible in older historical data may no longer exist today.
Backing all pre-match favourites across our 22 leagues produced a return of −6.43% in the 2000–2010 era. In the current era, 2021–2026, the same approach produced −0.75%. At first glance, losing less might sound like the market has become easier to beat. In reality, it usually points the other way: favourites now appear to be priced much closer to their true chance than they were in earlier periods.
Two seasons produced positive returns from this approach: 2022–23 at +2.15% and 2020–21 at +0.74%. These are not evidence that the strategy works. They are more likely variance around a long-run negative mean. But they do show that short-term positive windows can still appear, even within a broadly efficient market.
This is also why profitable football betting models and systems rarely stay static forever. As prices improve and old patterns become widely known, an edge can narrow, disappear or even turn negative. Any serious model needs regular monitoring, retesting and adjustment rather than assuming what worked in the past will keep working in the future.
For a value bettor operating today, the implication is clear: the bar for a genuine edge is higher than it was a decade ago. The era of relatively easy edges from broad category-level patterns has largely closed. Current edges, where they exist, are likely to be narrower, more specific, and dependent on better information or modelling than simple rules like “back favourites” or “back home teams”.
What Value Betting Looks Like in Practice
Genuine value betting requires a process. Most people who describe themselves as value bettors are not systematically applying one, they are making qualitative judgements and calling them value when they win.
A real value betting process has four components.
-
A defined model or framework. Your probability estimates need to come from somewhere consistent - a statistical model incorporating match data, or specialised knowledge of a specific league or competition that gives you an informational edge. Gut feeling is not a model.
-
Systematic comparison to implied probability. For every bet you consider, you calculate the implied probability from the available odds and compare it to your estimate. You only bet when your estimate materially exceeds implied probability by enough to cover the margin.
-
Records and calibration. Over time, you track whether your probability estimates are accurate. If you estimate 60% and the outcome occurs 55% of the time, your model is overconfident. Calibration, adjusting your estimates based on actual outcomes, is what separates systematic value betting from optimistic retrospective labelling of winning bets as "value."
-
Acceptance of variance. A value bet loses more than 40% of the time at odds of 1.70. A series of losing bets is not evidence that your model is wrong - it is normal. The only way to evaluate a value betting approach honestly is across large samples, not short runs.
Using Dedicated Betting as a Research Edge
Dedicated Betting is built to make football betting research faster, clearer and more evidence-led. Instead of starting from opinion, gut feel or isolated recent results, you can begin with structured data across 22 leagues, then use that context to judge where a match, team or market may deserve closer attention.
The league pages show how each competition is behaving this season, including home advantage, result splits, goal patterns and market performance. That helps you spot when a league is behaving differently from its longer-term profile, which can matter when assessing match prices.
The team pages go deeper into club-level performance. Home vs away form, points per game, win-rate splits and expectation-versus-reality data help show whether a team is performing broadly as the market expected, outperforming its implied level, or falling short.
The Best Home Teams ranking compares clubs across all 22 leagues, with time windows down to the last 10 matches. That makes it easier to separate teams with a genuine home-strength profile from teams that may simply be on a short-term run.
The site is not designed to hand out blind bets. It is designed to give bettors a stronger research base: which leagues are behaving unusually, which teams are outperforming expectations, where home or away strength may be meaningful, and where the market may already have adjusted. That context is where sharper betting analysis starts.
The Honest Assessment
Value betting is real. The football market does misprice outcomes, and our data shows specific, measurable patterns in where those mispricings have appeared across leagues, teams, seasons and price bands.
But it is also genuinely difficult. The market has become more efficient over 25 years, and the bookmaker’s margin absorbs most obvious edges. Even when favourites beat their implied probability in certain leagues or periods, the return from backing them blindly can still be negative. That is why serious betting analysis needs more than a hunch, a form table or a single attractive price.
This is where Dedicated Betting is designed to help. The site gives you league context, team profiles, market behaviour, home and away splits, rankings, historical patterns and expectation-versus-reality data in one place. It does not pretend every stat is a bet, but it gives you a better foundation for deciding which matches deserve attention and which prices may be worth questioning.
The most important habit a value bettor can develop is asking one question before every bet: what is my probability estimate for this outcome, why do I believe it differs from the implied probability in the odds, and is my estimated edge large enough to overcome the margin?
If you cannot answer that, you are not value betting, you are guessing with extra steps. Dedicated Betting exists to make that question easier to answer with data rather than guesswork.
Final thought: A value bettor finds bets where the bookmaker's implied probability underestimates the true likelihood of an outcome. The football market shows specific, data-backed patterns of mispricing, but the margin absorbs most edges, and consistent profit requires probability estimates that are both more accurate than the market and sufficiently better to overcome that margin.
All statistics drawn from the Dedicated Betting database, covering 182,031 matches with valid odds data across 22 football divisions from 2002–03 to 2025–26.
Related football articles
Football betting strategy: the full picture
For the complete analysis of what simple betting strategies actually return across 182,000 matches, including the era-by-era efficiency trend, read our Football Betting Strategy pillar article.
Home advantage and implied probability
One of the most consistent sources of contextual mispricing is home advantage - specifically whether a given match's home team premium is correctly priced. Our Home Advantage in Football Betting article covers the data.