A football betting system promises structure. Follow the rules, place the bets, collect the profits. The appeal is obvious: a system removes emotion, enforces discipline, and implies that someone has already done the hard work of figuring out what to bet on and how much to stake.
Most don't work. Not because they're poorly designed, some are mathematically coherent, but because they're solving the wrong problem.
There are two types of football betting system: selection systems, which tell you what to bet on, and staking systems, which tell you how much to bet. Our database covers 182,112 matches with odds data. We tested both.
Key takeaway: No simple selection system produces consistent long-run profit across our 22-league database. Staking systems cannot create a profit from a losing selection - they only change how quickly you lose and how catastrophically. The one exception that can work is the Kelly Criterion, but only when a genuine positive edge exists.
Selection Systems: What the Data Shows
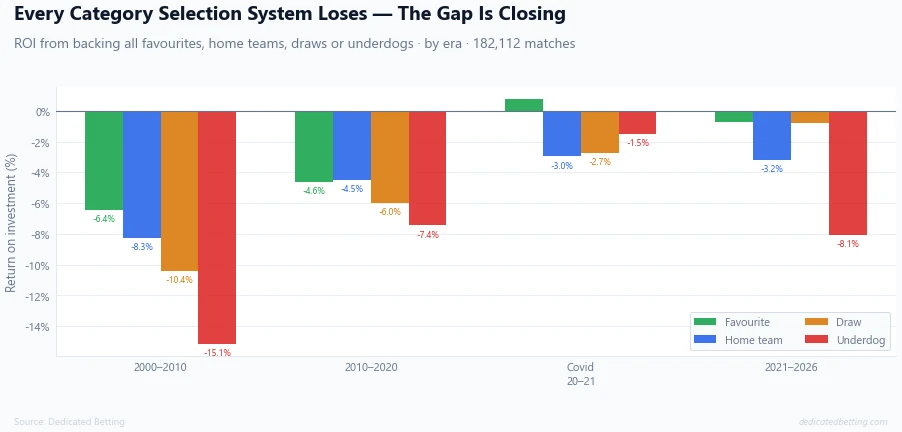
A selection system is any rule-based approach to choosing what to bet on. Back all home teams. Back all pre-match favourites. Back every draw. Back every underdog. These are the four most common category-level selection systems. We tested all of them.
| System | Overall ROI | Win rate | Avg odds |
|---|---|---|---|
| Back all favourites | −4.2% | 49.9% | 2.01 |
| Back all home teams | −5.4% | 44.4% | 2.51 |
| Back all draws | −6.2% | 26.6% | 3.68 |
| Back all underdogs | −9.8% | 23.5% | 4.63 |
Every system loses. The margins range from −4.2% for favourites to −9.8% for underdogs, the latter a loss rate that would eliminate a starting £1,000 bankroll to near-zero across a few hundred bets at level stakes.
The era trend is the most important part of this data. In the 2000–2010 era, backing all favourites produced −6.4% ROI. In the current era (2021–2026), the same approach produces −0.8%. The market has become dramatically more efficient at pricing these categories over 25 years, and every selection system has improved toward the break-even line.
In the 2020–21 Covid season, backing all favourites produced +0.7% - a genuine positive return driven by unusual market conditions. In 2022–23, the return was +2.2%. These are not evidence that the system works, they are variance around a long-run negative mean, demonstrating that the market is not perfectly efficient but efficient enough.
- The draw system is the most misrepresented in betting content. At −6.2% overall, it produces worse returns than backing favourites. In the 2000s it lost −10.4%. In the most recent era it has narrowed to −0.8%, almost breakeven, which explains why it currently attracts interest. But the historical data is clear: draw backing as a blanket approach has never been a long-run winner.
Staking Systems: The Mathematical Reality
A staking system determines how much to bet on each selection. The most commonly discussed are level stakes, Martingale, Fibonacci, percentage staking and the Kelly Criterion.
The critical point that almost no betting content addresses honestly: a staking system cannot turn a losing selection strategy into a profitable one. The underlying expected value is fixed by your selection approach. Staking rules change the variance profile and the speed at which outcomes are realised, they do not change the expected outcome.
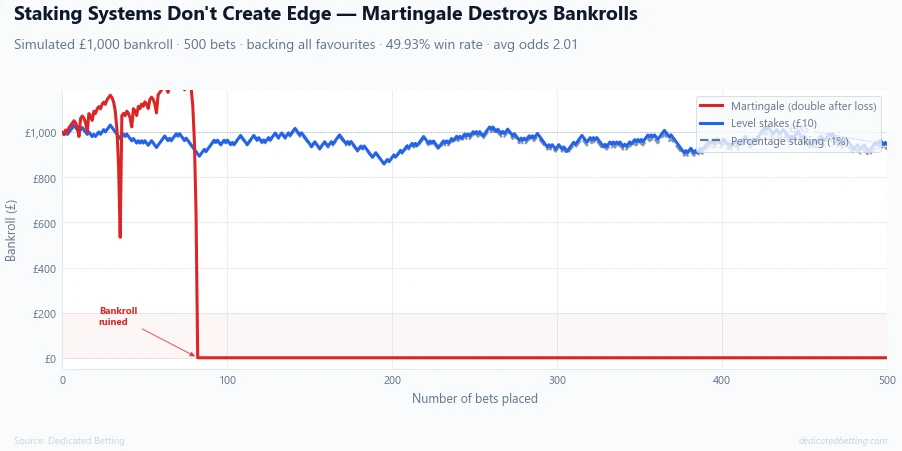
To demonstrate this, we simulated 500 bets using the real historical parameters from our database: backing all favourites at 49.93% win rate, average odds 2.01, starting bankroll £1,000.
-
Level stakes (£10 per bet) produces a gradual decline in line with the −4.16% expected ROI. The bankroll falls modestly over time but the decline is predictable and slow, you retain the ability to continue betting and wait for variance to play out.
-
Percentage staking (1% of current bankroll per bet) produces a very similar trajectory to level stakes. Because stakes shrink as the bankroll shrinks, it theoretically never reaches zero, but it converges toward it asymptotically while providing no path to recovery.
-
Martingale (double stake after each loss, reset after a win) produces a dramatically different risk profile. In this simulation the bankroll hits zero, complete ruin, before bet 500. A sequence of consecutive losses forces exponentially larger stakes: a run of seven losses at £10 starting stake requires a £1,280 bet on the eighth selection just to recover to flat. With a bankroll of £1,000 and a starting stake of £10, six consecutive losses consume £630 and the required seventh bet (£640) exceeds the remaining bankroll.
-
The Martingale system is not flawed in its logic - it correctly identifies that a win eventually recovers all losses. The flaw is that it assumes unlimited bankroll and no table limits. Both assumptions fail in practice. A realistic bankroll runs out before the required recovery stake can be placed.
-
Fibonacci and the 1-3-2-4 system are variants of the same idea: increase stakes in a defined progression and reset after certain outcomes. They share the same mathematical limitation as Martingale, they modify variance but cannot overcome a negative expected value. They reduce the catastrophic loss risk compared to Martingale, but they don't create profit.
The One Staking System Worth Understanding
The Kelly Criterion is mathematically different from the others. It is not a staking system in the conventional sense, it is a formula for determining the optimal fraction of bankroll to bet given a genuine positive edge.
The Kelly formula is: f = (p × (b+1) − 1) ÷ b
Where f is the fraction of bankroll to bet, p is your estimated win probability, and b is the decimal odds minus 1.
At our historical favourite parameters - win rate 49.93%, odds 2.01 - the Kelly formula produces a negative value. Kelly is telling you not to bet, because the expected value is negative. This is the correct answer.
Now apply Kelly with a genuine edge: a team you estimate has a 53% chance of winning, priced at 2.01 (implying 49.75%):
f = (0.53 × 2.01 − 1) ÷ 1.01 = 0.0647
Kelly recommends staking 6.47% of bankroll on this bet. A £1,000 bankroll means a £64.70 stake. With genuine edge applied consistently, Kelly maximises long-run bankroll growth better than any other staking system.
The reason Kelly only works with genuine edge is fundamental: it is a bankroll growth formula, not a way of manufacturing edge from nothing. Apply Kelly to a negative EV selection and it correctly tells you to bet zero. Force it to produce a positive value by overestimating your win probability and you are not running Kelly, you are running an overconfident Martingale variant.
Why Most Systems Ultimately Fail
The systems described in most betting content fail for one of three reasons.
-
The selection approach has no edge. Most category-level systems - back all favourites, back all underdogs, back all draws - have documented negative ROI across our full dataset. No staking system rescues a selection approach with a built-in loss.
-
The edge has already been priced away. The era trend data shows betting markets pricing category-level patterns more efficiently over time. A system backtested on 2005–2015 data may show a positive return in that dataset, but a decade of bookmaker learning has closed most of those gaps. Testing on historical data proves what worked in the past, not what works now.
-
The sample size is too small to distinguish edge from variance. Football betting variance is extremely high. A system producing +10% ROI over 100 bets is almost certainly variance rather than genuine edge, you would need thousands of bets in a controlled environment to distinguish the two with statistical confidence. Most systems described in betting content have been observed over far too small a sample to reach meaningful conclusions.
What a Real Football Betting System Looks Like
A genuine betting system requires two components working together: a selection approach with genuine positive expected value, and a staking approach that manages bankroll appropriately for that edge.
The selection component must be grounded in probability estimation rather than category backing. The value betting framework in our supporting article explains this in detail, the core requirement is a probability estimate that materially exceeds the implied probability in the odds and does so by more than the bookmaker's margin.
The staking component, given genuine edge, should be proportional. Fixed percentage or fractional Kelly both perform well with genuine edge. The key principle is that stakes should scale with bankroll rather than being fixed in nominal terms, this preserves the ability to continue after a losing run and compounds growth during a winning one.
Record-keeping is the third element that most system descriptions omit. Without detailed records of your probability estimates and the actual outcomes, you cannot determine whether your selection approach has genuine edge or whether observed profits are variance. Calibration, checking whether events you estimated at 60% actually occur around 60% of the time, is the mechanism that separates genuine value bettors from those who have convinced themselves they have edge.
Using Our Data as a System Input
The data on Dedicated Betting is not a betting system, it is context for building one. Used correctly, it feeds into a probability estimation process and enables you to make better decision, which leads to higher profits.
-
The league pages show current season home advantage data and the performance profile of specific competitions. Knowing that the Premier League currently shows weak home advantage (+0.09 goals per match this season) is relevant when estimating home team win probability in a specific fixture, it adjusts the baseline you start from.
-
The team pages show current season Home vs Away Form - home PPG, away PPG, win rate splits. A team averaging 2.1 PPG at home versus 0.8 PPG away has a structural home advantage significantly above the league average. Combined with the current odds, this inputs directly into a probability estimate.
-
The Best Home Teams ranking covers all 22 leagues with time windows down to the last 10 matches. The multi-window view helps distinguish structural strength from short-term form, both relevant to probability estimation.
None of this replaces the fundamental requirement: your probability estimate must be better than the market's, and the difference must exceed the bookmaker's margin. The data provides the inputs. Building accurate probability estimates from those inputs is the system.
Summary
Football betting systems fall into two categories. Selection systems, backing categories of teams, produce documented negative ROI across every approach we tested in 182,112 matches. The margin has been improving toward breakeven as markets have become more efficient, but no category system has produced a consistent long-run profit.
Staking systems - Martingale, Fibonacci, 1-3-2-4, percentage staking - cannot create profit from a losing selection approach. They modify variance. Martingale specifically amplifies the risk of catastrophic loss; our simulation shows complete bankroll ruin in under 500 bets at real favourite win rates and odds. Kelly Criterion is the one exception, but it only produces positive recommendations when genuine positive edge exists.
A real football betting system requires a selection approach with genuine edge, a proportional staking method, and rigorous record-keeping that allows calibration over time. Each component is necessary. None is sufficient alone.
Final thought: Staking systems cannot turn a losing selection approach into a profitable one, they only change how quickly and how dramatically you lose. Martingale is particularly dangerous. The only path to long-run profit is a selection approach with genuine positive expected value. Building and testing that edge is the actual challenge.
Staking simulation uses real historical parameters: backing all pre-match favourites across 22 leagues, 49.93% win rate, average odds 2.01. 500 bets simulated from a £1,000 bankroll starting with a £10 unit stake. Selection system ROI figures drawn from the Dedicated Betting database: 182,112 matches with valid odds data across 22 divisions from 2002–03 to 2025–26.
Related football articles
Football betting strategy: the full picture
For the complete analysis of what simple betting strategies actually return across 182,000 matches, including the era-by-era efficiency trend, read our Football Betting Strategy pillar article.
Is home advantage declining in the Premier League?
The Premier League's home advantage story since 1993 - including the full Covid season analysis and the goals data behind the decline - is in our Premier League home advantage article.