Yes. Premier League home advantage is declining, and the most recent season was the second worst on record!
But the story is more specific than most analysis suggests. Home teams in the Premier League are not scoring fewer goals. They are conceding more, because away teams are scoring at rates that would have been remarkable twenty years ago. The decline in home advantage is being driven almost entirely from one direction: the away end.
This article covers every Premier League season from 1993–94 to 2025–26, including how the PL compares to the broader European trend, what the era-by-era data shows, and what it means for the betting markets.
Key takeaway: Premier League home advantage exists but is at historically low levels. 2024–25 produced the second weakest home advantage season since the league began, beaten only by the no-fans Covid season of 2020–21.
The 33-Season Picture
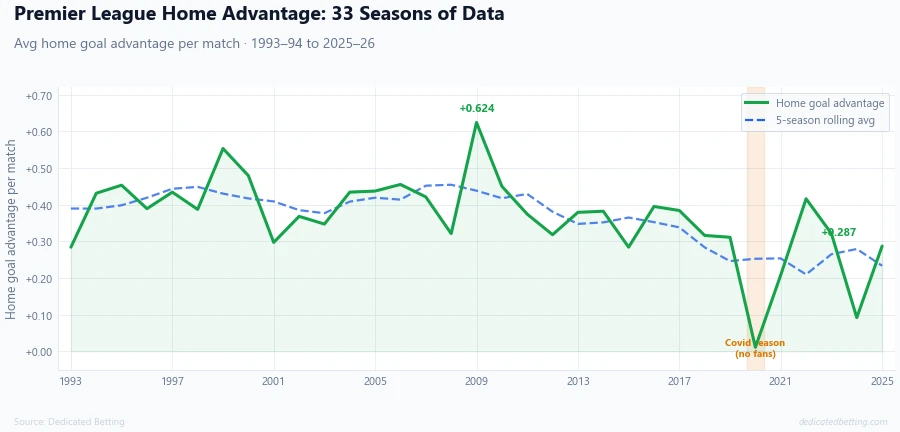
The chart tells a clear story. Home advantage peaked in 2009–10 at +0.62 goals per match, home teams won 50.8% of matches that season while away teams won only 24.0%. The rolling average held relatively stable through the 2000s before beginning a sustained decline from around 2011 onward. The most recent completed season, 2024–25, sits at just +0.09 - the lowest non-Covid reading in the entire dataset.
The era breakdown makes the scale of the change concrete.
| Era | Matches | Home win % | Draw % | Away win % | Home goals/game | Away goals/game | Goal advantage | Home PPG | Away PPG |
|---|---|---|---|---|---|---|---|---|---|
| 1993–2000 | 2,824 | 45.5% | 28.2% | 26.4% | 1.5 | 1.1 | +0.4 | 1.6 | 1.1 |
| 2000–2010 | 3,800 | 47.2% | 25.7% | 27.1% | 1.5 | 1.1 | +0.4 | 1.7 | 1.1 |
| 2010–2020 | 3,734 | 45.6% | 24.7% | 29.7% | 1.6 | 1.2 | +0.4 | 1.6 | 1.1 |
| 2020–21 Covid | 446 | 39.7% | 21.8% | 38.6% | 1.4 | 1.3 | +0.1 | 1.4 | 1.4 |
| 2021–2026 | 1,869 | 44.2% | 23.6% | 32.2% | 1.6 | 1.3 | +0.3 | 1.6 | 1.2 |
Two eras stand out. The 1990s and 2000s were almost identical, home win rates in the mid-to-high 40s, away teams winning barely more than one match in four, home advantage around +0.42 to +0.42. Then 2010–2020 marked the first meaningful decline, followed by a sharper drop in the current era. In 2021–2026, away teams are winning 32.16% of matches, a figure that would have been extraordinary in the early years of the Premier League.
The Real Mechanism: Away Goals, Not Fewer Home Goals
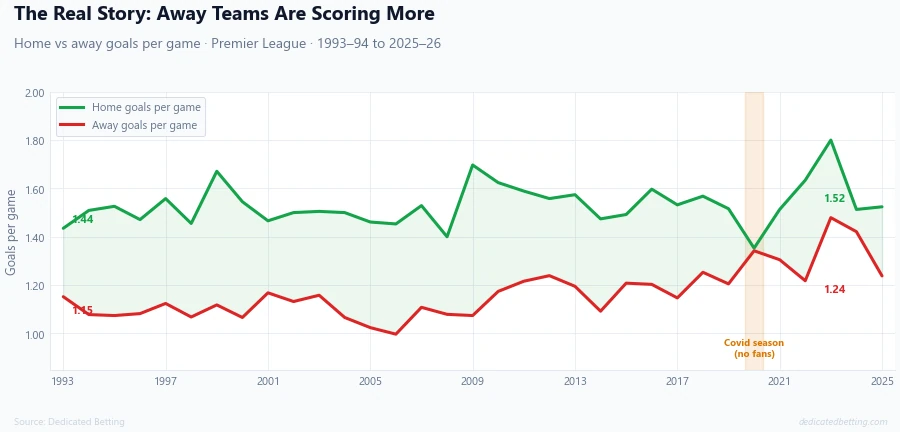
This chart is the most important piece of analysis in the article. The widespread narrative around declining home advantage assumes home teams are performing worse at home. The data does not support that.
Home teams in the Premier League scored 1.44 goals per game in 1993–94. In 2025–26 so far, they are scoring 1.52. Home scoring has been broadly flat across 33 seasons, with normal season-to-season variation around a stable mean.
Away teams tell a completely different story. Away scoring was 1.15 goals per game in 1993–94. By 2021–22 it had reached 1.31, by 2023–24 it was 1.48, and in 2024–25 away teams averaged 1.42 goals per game - a 24% increase over the early Premier League era.
The drivers are consistent with what we know about the broader decline of home advantage across European football: better away preparation through video analysis, improved sports science around travel recovery, the growing tactical sophistication of away game structures, and VAR reducing the crowd-driven referee bias that historically benefited home teams. Away teams are simply better equipped to score than they were in 1993.
How the Premier League Compares to the European Average
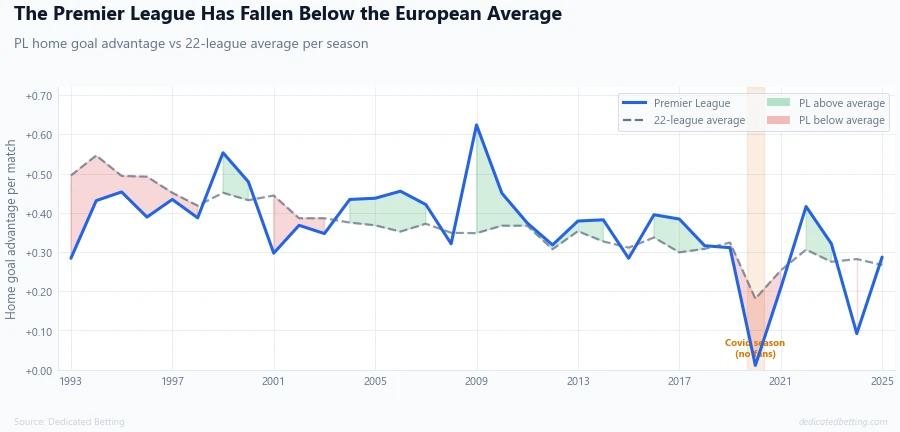
The Premier League has never been the strongest home advantage league in Europe. In the early seasons of our dataset the 22-league average was significantly above the PL, partly because the sample was dominated by strong home advantage leagues like the Greek Superleague, Ligue 1 and Serie A which were all at their historical peaks in the mid-to-late 1990s.
From roughly 2005 onward the PL tracked close to or above the European average as those other leagues declined faster than the Premier League. That position has now reversed sharply. In 2024–25, the Premier League's +0.09 was well below the 22-league average of +0.28. In the last five completed seasons, the PL has been below the European average in three.
This matters for anyone using generic home advantage assumptions in their analysis. The Premier League is no longer a high home advantage environment by European standards. It is currently among the weakest.
Away Wins Have Risen in Every Era
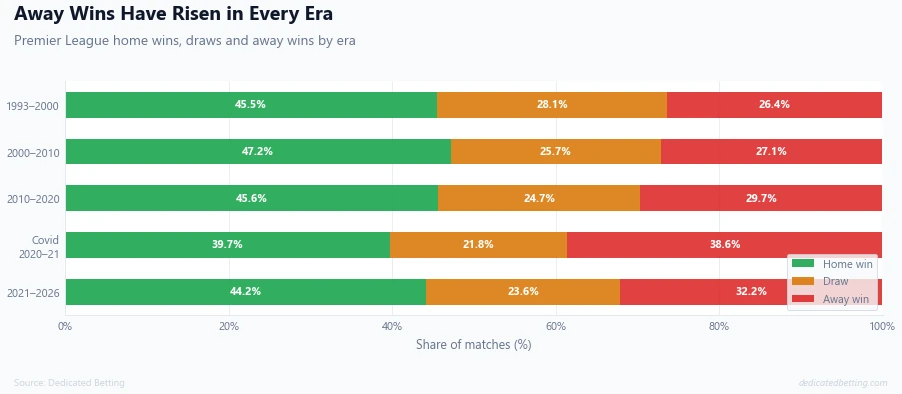
The era breakdown visualises the structural shift cleanly. Away wins have risen from 26.4% in 1993–2000 to 32.0% in 2021–2026 - a rise of nearly six percentage points. Home wins have fallen from 45.5% to 44.2%. The draw percentage has also declined, from 28.2% to 23.7%, suggesting fewer games are now settling as low-scoring stalemates and more are producing a decisive result one way or the other.
The Covid season stands apart. With no crowd present, away wins reached 38.6% - a figure unprecedented in the league's history and a sharp demonstration of how much crowd effects contribute to home advantage. The league did not permanently absorb that result, but it also did not fully recover. The 2021–2026 era sits at a structural level of home advantage that is materially lower than any previous non-Covid era.
The Betting Angle: Has the Market Kept Up?
Premier League home odds tell their own story. In 2002–03, the first season with odds data in our database, the average home team was priced at 2.24. By 2017–18 and 2018–19, as the Premier League home advantage remained relatively strong through the 2010s while being seen as a premium product, average home odds had risen to 3.16 and 3.29 respectively.
Since then, as the decline has accelerated, odds have come back down. In 2024–25 the average home team was priced at 2.90 - closer to the 2009–10 level than the late 2010s peak. The market has noticed.
The season-by-season ROI picture illustrates why single-season results should be treated as noise rather than signal. Of the 24 seasons with odds data, 10 produced positive returns from blindly backing all home teams. Individual seasons ranged from +13.5% in 2022–23 to −15.3% in 2024–25. The all-time ROI across all 24 seasons is −1.54% - the least negative of any league in our database, reflecting how efficiently the Premier League is priced.
Two conclusions from this:
-
The market broadly reflects the level of home advantage. As home advantage has declined, odds have adjusted. There is no persistent structural inefficiency simply from knowing home teams win more often. The value, when it exists, is in identifying specific mismatches in individual fixtures - not in backing the home team as a category.
-
Single seasons are not trends. 2022–23 produced strong home ROI and appeared to signal a recovery in home advantage. 2024–25 was the worst season in the non-Covid era. Both are consistent with the underlying variance of a 380-match sample and do not individually tell us whether the long-term trend has changed direction.
What It Means for Betting on Premier League Home Teams
Home advantage in the Premier League is a real factor, but it is no longer a strong one by historical or European standards. At +0.26 per match across the current era, home teams earn roughly 0.36 points per game more than away teams in the same fixtures. That is a genuine edge, but the market prices it in.
The practical application is about precision rather than blanket assumptions:
-
Check the current season data, not the all-time average. Our Premier League league page shows current season home vs away performance, the Home Advantage card in Betting Insights, and the league table in Home-only view. These reflect where the league actually is this season, not where it was in 2006.
-
Use team-level data. League-level home advantage is context. What matters for any specific fixture is whether that home team performs significantly better at home than away. Our team pages show current season Home vs Away Form - home PPG vs away PPG, win rate splits - which tells you whether a specific club is genuinely home-strong or just part of the league's aggregate.
-
2024–25 was an unusual season. Away teams won 34.74% of Premier League matches, the highest in any non-Covid season in our database. Whether that level persists in 2025–26 or reverts toward the era average remains to be seen. Early 2025–26 data suggests some recovery, with away win rate tracking closer to 31% through the matches played so far.
Summary
Premier League home advantage is declining. The 33-season data is clear on that. But the mechanism is specific: away teams are scoring more goals, not home teams scoring fewer. Away goals have risen by roughly 24% since the early 1990s. Home scoring has barely changed.
The era data confirms the decline happened in two phases: a modest drop from 2010–2020, followed by a sharper fall in the current era. The 2024–25 season was the second weakest on record.
The Premier League is now below the 22-league European average for home advantage in recent seasons, a position that would have seemed unlikely a decade ago.
Home advantage has not disappeared. It is just substantially smaller than it used to be, and the market has largely priced in the change. The edge for bettors lies not in knowing that home teams win more often, but in identifying the specific fixtures where the home team's actual advantage is greater or lesser than the odds suggest.
Final thought: Home advantage in the Premier League is real but now historically weak. The main driver is rising away goals, not falling home performance. The all-time ROI from backing PL home teams is −1.54% - the market knows.
All statistics drawn from the Dedicated Betting database, covering 12,673 Premier League matches across 33 seasons from 1993–94 to 2025–26.
Related football articles
Which leagues have the biggest home advantage?
The Premier League's home advantage looks different when compared against all 22 leagues in our database. Our League Comparison article ranks every competition and shows how the rankings have shifted over the past 30 years.
Does home advantage still matter in football?
For the broader picture across all 22 leagues and the full 33-season trend, read our Home Advantage in Football pillar article.