Quick answer: Yes. Home teams still win more often and score more goals in football than away teams. But the advantage has weakened significantly over the past three decades, varies widely depending on the league, and is already priced into the betting markets. Understanding what it is, and what it isn't, matters.
What the Numbers Actually Show
We analysed 239,669 football matches across 22 leagues and 11 countries, spanning 33 seasons from 1993 to 2026. The overall picture is clear.
- Home teams win 45.05% of matches.
- Away teams win 28.16%.
- Draws make up the remaining 26.79%.
Home teams also score more. Across all 239,669 matches home sides averaged 1.50 goals per game against 1.14 for away teams - a home goal advantage of +0.36 per match.
Key takeaway: Home advantage is real. But the more interesting question is whether it is as real as it used to be.
What Is Home Advantage in Football?
Home advantage refers to the measurable tendency for teams to perform better when playing at their own stadium compared to when they play away from home. It shows up consistently across multiple metrics: win rate, goals scored, points per game, and goal difference.
It is not a myth or a perception bias. The data across most professional football leagues shows that, all else being equal, playing at home improves a team's result. The question is by how much, in which competitions, and whether that edge has changed over time.
Home Advantage Has Declined - The Data Tells the Story
This is the section most competing articles either miss entirely or handle with vague references to a "general decline." Our database covers 33 seasons, which gives us something more precise.
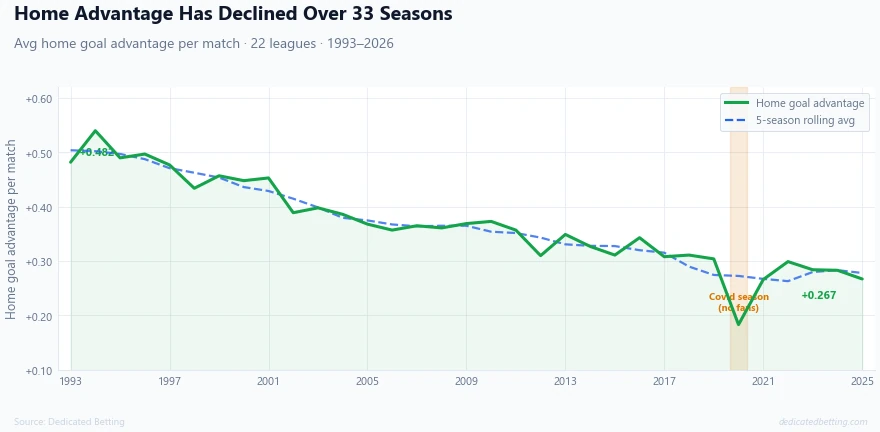
The trend is unmistakeable. In the early 1990s, home teams outscored away teams by an average of +0.48 goals per game. By the mid-2020s, that figure has fallen to around +0.27. The shift is not a recent blip - it has been gradual and consistent across decades.
Breaking the data into eras makes the scale of the change clearer.
| Era | Matches | Home win % | Draw % | Away win % | Home goal advantage |
|---|---|---|---|---|---|
| 1993–2000 | 43,008 | 47.23% | 27.56% | 25.21% | +0.480 |
| 2000–2010 | 73,636 | 45.78% | 27.10% | 27.12% | +0.388 |
| 2010–2020 | 76,940 | 44.43% | 26.45% | 29.13% | +0.330 |
| 2020–21 (Covid) | 7,648 | 40.83% | 26.31% | 32.86% | +0.183 |
| 2021–2026 | 38,437 | 43.28% | 26.15% | 30.57% | +0.280 |
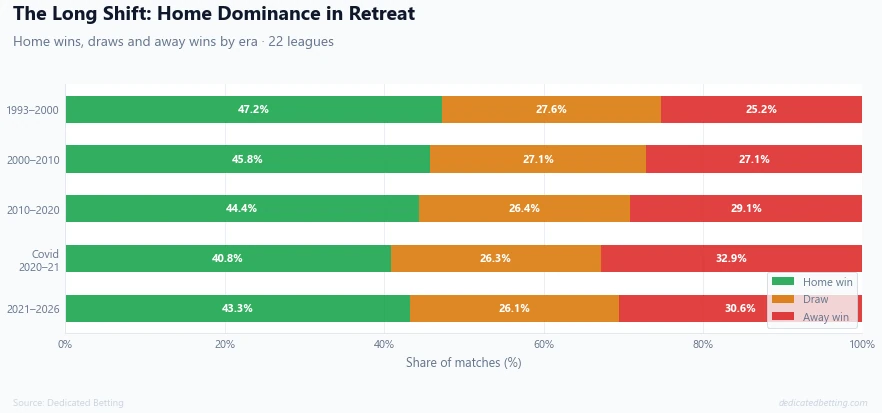
In the 1990s, home teams won almost half of all matches. Away teams won barely one in four. In the most recent period, home wins have dropped to 43% and away wins have risen to over 30%. The gap is closing.
The Covid season of 2020–21, when most matches were played behind closed doors, produced the most extreme result: a home win rate of just 40.83% and a goal advantage barely above +0.18. That season is often cited as proof that crowds drive home advantage. The data supports the argument - though it also shows the underlying decline was already well established before fans were removed.
Why Is Home Advantage Declining?
The same factors that create home advantage have been gradually weakened by changes in how professional football is played and organised.
Travel has become less of a disadvantage. Modern sports science has transformed how clubs manage away fixtures. Recovery protocols, travel nutrition, pre-match preparation routines and charter flights for top-level clubs have reduced the physical cost of travelling. What was a genuine physical burden in the 1990s is now a managed variable for well-resourced squads.
Pitches and stadiums have been standardised. The quirks of home grounds that once gave local players a genuine edge - uneven surfaces, unusual dimensions, unpredictable bounces - have largely been removed. Modern pitch management and stadium regulations have made playing surfaces more uniform across leagues. The familiar ground advantage has narrowed accordingly.
Data & Video analysis has eliminated the unknown. Away teams now arrive with detailed knowledge of the opposition: tactical patterns, set-piece routines, individual tendencies. The informational advantage that home teams once held - playing in familiar surroundings against a team with less preparation - has been substantially eroded by the ubiquity of data and footage.
All-seater stadiums and changing crowd dynamics have reduced atmosphere. The shift from standing terraces to all-seater stadiums, commercialisation of matchday experience, and changing crowd demographics have altered the intensity of home atmospheres in many grounds. The intimidating, hostile environment that once reliably unsettled visiting players is less consistent than it was.
VAR and referee development have reduced home bias. The marginal refereeing decisions that consistently favoured home teams are harder to make - or go unscrutinised - in an era of video review. The crowd can no longer influence a decision that is being reviewed on a screen by an official in a separate room.
The 2020–21 Covid season compressed all of this into a single data point. Strip out the crowd entirely and home advantage collapsed to its lowest recorded level - a goal advantage of just +0.18 compared to the long-run average of +0.36. That experiment did not create the decline, but it confirmed that crowd effects are the single largest remaining driver of whatever home advantage persists today.
Why Does Home Advantage Exist?
Several factors have been identified by researchers and analysts as contributors to home advantage. They tend to work together rather than in isolation.
-
Crowd pressure. Home crowds create noise, atmosphere and psychological pressure on opposition players and officials. The effect on referees has been documented in academic research - home teams receive fewer yellow cards and more favourable decisions in contested situations. The 2020–21 Covid season provided a natural experiment: without fans, that pattern largely disappeared.
-
Stadium and pitch familiarity. Home players know the dimensions of their pitch, the bounce of the turf, and the positions of the floodlights. These are marginal advantages, but professional sport is often decided by margins.
-
Travel fatigue. Away teams travel to unfamiliar cities, sometimes overnight or across time zones in international competitions. The physical and mental drain of travel is a genuine disadvantage, particularly in lower leagues where resources are limited.
-
Psychological factors. Playing in front of a supportive home crowd affects confidence, communication and risk-taking. Teams at home tend to play more expansively. Away teams often adopt more conservative tactics - setting up to defend and counter - partly because the crowd and unfamiliar environment push them into a more cautious posture.
-
Referee bias. Not deliberate, but measurable. Studies consistently show referees make marginally more favourable decisions for home teams, likely influenced by crowd noise and social pressure. The absence of crowds in the 2020–21 season reduced - though did not eliminate - this effect.
Home Advantage Varies Widely Across Leagues
One of the most important findings in our database is that home advantage is not uniform. The difference between a high home advantage league and a low one is substantial.
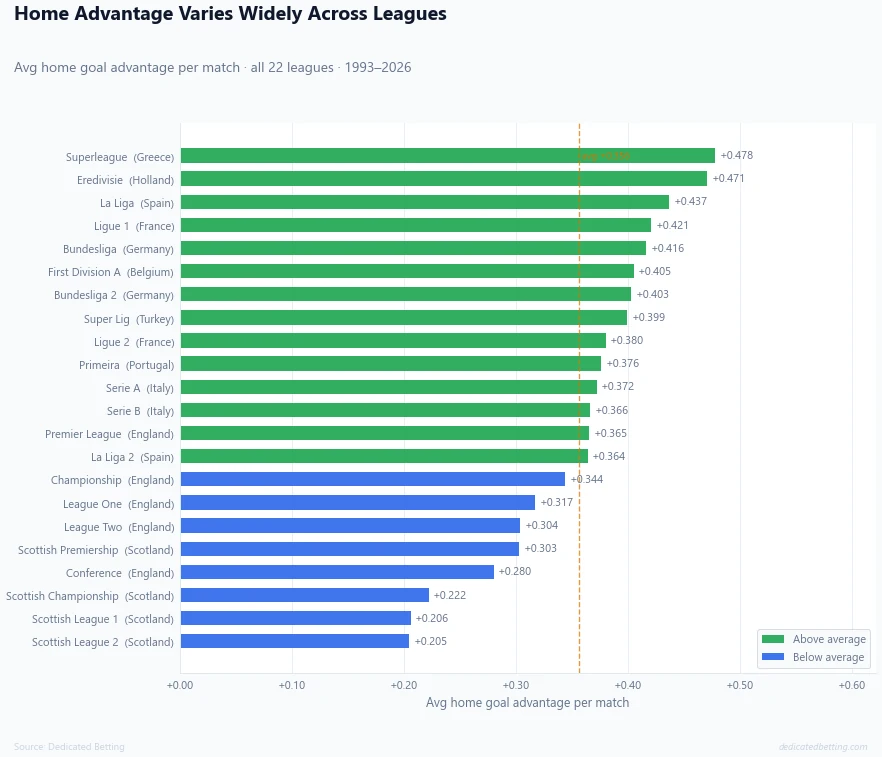
Greek Superleague and the Dutch Eredivisie sit at the top of the rankings with home goal advantages above +0.47. Spain's La Liga, France's Ligue 1 and the German Bundesliga follow closely, all above +0.40.
At the other end, the Scottish lower divisions show the weakest home advantage in the database - Scottish League 2 records just +0.205, with Scottish League 1 and Championship similarly low. The English Conference and Scottish Premiership also sit significantly below the overall average.
The reasons behind these differences are not fully explained by any single factor, but stadium atmosphere, travel distances, pitch quality and the competitive depth of each league all likely play a role. In leagues where the standard is more even and resources more modest, the home edge appears weaker.
For bettors, this variation matters. Applying a generic "home advantage" assumption across all leagues is a simplification that the data does not support.
Does Home Advantage Translate Into Betting Profit?
The short answer: no. Not if you approach it blindly.
We tested the simplest possible home advantage strategy - backing every home team at the best available odds across all matches where odds data was available. The result across 182,123 matches: a return on investment of −5.90%, a loss of 10,736 units on level stakes.
The betting market already knows home teams win more often. That knowledge is baked into the odds. A home team priced at 2.49 - the average across our dataset - needs to win more than 40% of the time just to break even. Home teams do win more than 40% of the time. But not by enough to overcome the bookmaker's margin.
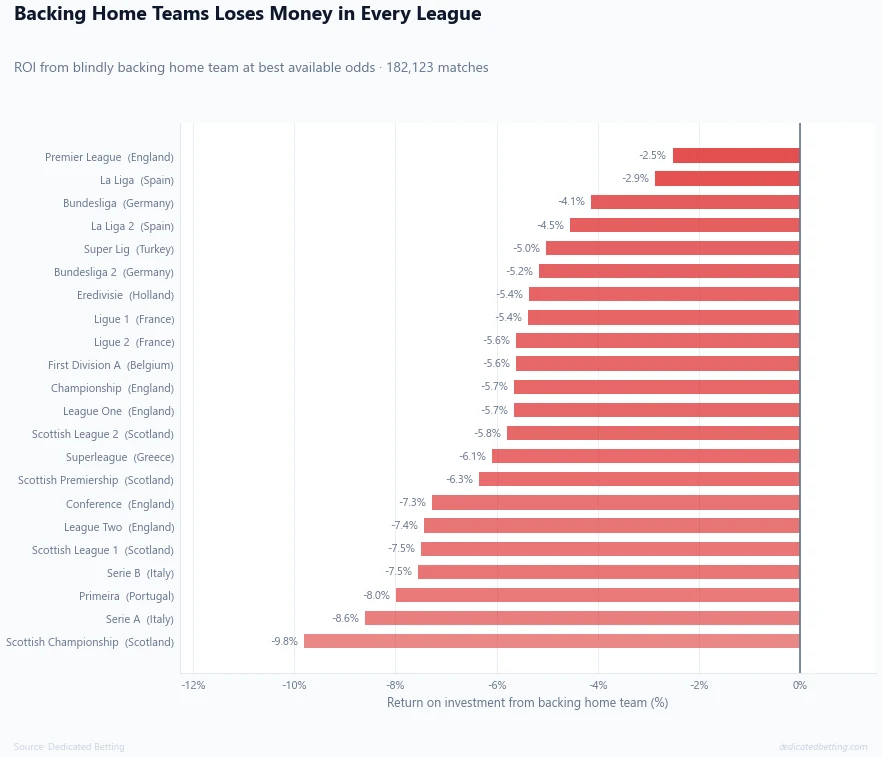
The pattern holds across every single league in the database. Not one produces a positive return from blind home backing.
The losses are not equal, though. The Premier League (−2.52%) and La Liga (−2.86%) show the smallest losses, reflecting tighter, more efficient pricing at the top level. Scottish lower divisions and Serie B sit closer to −8% to −10% - higher losses, suggesting less market efficiency but also insufficient volume to exploit.
Looking at the same question across eras adds an important dimension.
| Era | Matches with odds | Avg home odds | Home back ROI |
|---|---|---|---|
| 2000–2010 | 59,303 | 2.28 | −8.27% |
| 2010–2020 | 76,784 | 2.58 | −3.14% |
| 2020–21 (Covid) | 7,644 | 2.71 | −8.65% |
| 2021–2026 | 38,392 | 2.58 | −7.20% |
The 2010–2020 era stands out. Returns improved substantially during this period, likely because home advantage was declining in reality while the market was still pricing it at historically elevated levels. The gap between perceived and actual advantage narrowed the bookmaker's effective edge. By 2021 onwards, the market has recalibrated - average home odds drifted out compared to the 2000–2010 era, but losses worsened again. Post-Covid, the market appears to be repricing home advantage more accurately than it did during the 2010s.
The implication is important: home advantage is a factor, not a system. Knowing a team is playing at home tells you something real, but it doesn't tell you enough to overcome the bookmaker's margin on its own. What matters is whether a specific home team, in a specific context, is priced at a level that underestimates their actual probability of winning.
How to Use Home Advantage in Your Analysis
Home advantage is a legitimate input into match assessment - not a shortcut. Here is how to think about it practically.
-
Start at the league level. Not every league has the same home advantage profile, and the difference is material. Our league pages include a League Behaviour card in the opening summary that flags whether the current season is showing a strong home advantage, a slight lean, or a balanced home/away split. The Betting Insights section goes further with a dedicated Home Advantage card, showing exactly how much more often home teams are winning versus away teams this season, alongside typical market prices. You can also switch the league table to a Home-only view to see current season home performance in isolation for every team in that division.
-
Drill into the team. League-level home advantage tells you about the environment; team-level data tells you about the individual. Our team pages show current season Home vs Away Form in the Betting Profile - average points per home game, average points per away game, win rate splits - alongside a full Home/Away stats table. The Team Intelligence summary also flags patterns worth knowing: whether a side is performing consistently home and away, showing a strong home bias, or - less commonly - actually performing better away from home.
-
Use the rankings for cross-league context. Our Best Home Teams ranking cuts across all 22 leagues and lets you filter by time window - current season, last 10 matches, last 25 matches, last 100 matches, or last 10 seasons. That last window in particular is useful for identifying whether a team has a genuine long-term home fortress tendency or whether recent home form is an anomaly.
-
Put it in context of the odds. A home team priced at 1.40 already has the home premium built in and then some. A home team priced at 2.20 in a league with historically strong home advantage may be a different conversation. The edge, when it exists, comes from identifying situations where the home advantage is real and the odds haven't fully accounted for it - not from treating every home fixture as an opportunity by default.
-
Weight it against current form. Home advantage is a baseline tendency, not a guarantee. A team in poor form playing at home against a side in excellent away form is not automatically a sensible home bet. The data gives you the context; you still have to apply the judgement.
Summary: Does Home Advantage Still Matter?
Yes, but not as much as it did. Across 239,669 matches, home teams still win more often (45.05%) and score more goals than away teams. The home advantage is real and persistent.
But the edge has narrowed substantially. The average home goal advantage has fallen from +0.48 in the 1990s to +0.28 today. Away teams now win nearly one in three matches - a significant shift from the late 1990s when they won barely one in four.
The advantage varies considerably by league, with Southern European competitions tending to show stronger home effects than the British lower divisions.
And it is already reflected in the odds. Blindly backing home teams across all leagues and seasons produces a consistent loss. The market is not blind to home advantage - it prices it in.
Where it goes from here is genuinely uncertain. The decline has been consistent across three decades and shows no sign of reversing. If crowd atmosphere is the largest remaining driver - as the Covid data strongly implies - then the continued commercialisation of the matchday experience, the growth of neutral-venue tournaments and the further adoption of VAR all point in the same direction.
Whether the advantage stabilises at its current level or continues to erode toward something close to zero is a question the data cannot yet answer. What it can tell us is that anyone still applying 1990s assumptions about home advantage to modern football is working with the wrong numbers.
Key takeaway: Home advantage is real and measurable - but it is smaller than it has ever been, and the trend is still pointing down.
All statistics in this article are drawn from the Dedicated Betting database. At point of writing covering 239,669 matches across 22 football divisions from July 1993 to May 2026.