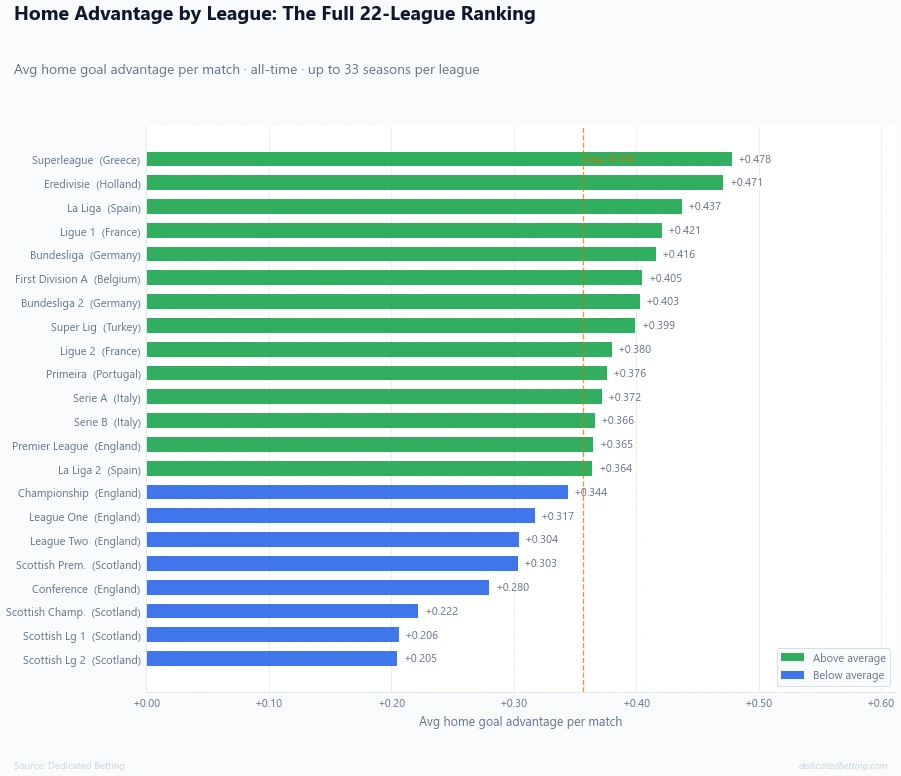
Home advantage is not the same in every league. The difference between the top and bottom of our 22-league ranking is more than double - and the order is not what most football fans would expect.
The Greek Superleague has the strongest all-time home advantage in our database. The Premier League sits 13th. The Bundesliga, not a league typically associated with tribal home atmospheres, currently leads every league in our most recent five-season data.
This article ranks all 22 leagues using football statistics on home advantage across up to 33 seasons, examines how the picture has changed over time, and looks at what those differences actually mean for the betting markets.
Key takeaway: Home advantage varies enormously across leagues. Applying the same assumptions about home teams regardless of which competition you are betting on is one of the most common analytical errors in football betting.
The Full 22-League Ranking
The table below covers every league in our database, ranked by average home goal advantage per match. It includes home win percentage, away win percentage, home points per game and away points per game, a complete picture of the home vs away split by league.
| League | Country | Seasons | Home win % | Draw % | Away win % | Home PPG | Away PPG | Goal diff |
|---|---|---|---|---|---|---|---|---|
| Superleague | Greece | 27 | 48.9% | 24.3% | 26.8% | 1.7 | 1.0 | +0.5 |
| Eredivisie | Holland | 33 | 47.3% | 23.6% | 29.1% | 1.7 | 1.1 | +0.5 |
| La Liga | Spain | 33 | 47.3% | 25.8% | 26.9% | 1.7 | 1.1 | +0.4 |
| Ligue 1 | France | 33 | 46.3% | 27.9% | 25.8% | 1.7 | 1.1 | +0.4 |
| Bundesliga | Germany | 33 | 46.0% | 25.5% | 28.5% | 1.6 | 1.1 | +0.4 |
| First Division A | Belgium | 31 | 46.5% | 24.5% | 29.0% | 1.6 | 1.1 | +0.4 |
| Bundesliga 2 | Germany | 33 | 45.5% | 27.6% | 26.8% | 1.6 | 1.1 | +0.4 |
| Super Lig | Turkey | 32 | 46.9% | 24.9% | 28.2% | 1.7 | 1.1 | +0.4 |
| Ligue 2 | France | 30 | 44.5% | 31.0% | 24.5% | 1.6 | 1.0 | +0.4 |
| Primeira | Portugal | 32 | 46.3% | 25.5% | 28.2% | 1.6 | 1.1 | +0.4 |
| Serie A | Italy | 33 | 45.4% | 27.5% | 27.1% | 1.6 | 1.1 | +0.4 |
| Serie B | Italy | 29 | 44.0% | 32.3% | 23.7% | 1.6 | 1.0 | +0.4 |
| Premier League | England | 33 | 45.6% | 25.5% | 28.8% | 1.6 | 1.1 | +0.4 |
| La Liga 2 | Spain | 30 | 44.5% | 30.1% | 25.4% | 1.6 | 1.1 | +0.4 |
| Championship | England | 33 | 44.4% | 27.4% | 28.2% | 1.6 | 1.1 | +0.3 |
| League One | England | 33 | 44.2% | 26.8% | 29.0% | 1.6 | 1.1 | +0.3 |
| League Two | England | 33 | 43.2% | 27.5% | 29.3% | 1.6 | 1.2 | +0.3 |
| Scottish Premiership | Scotland | 32 | 43.6% | 24.2% | 32.1% | 1.6 | 1.2 | +0.3 |
| Conference | England | 21 | 43.2% | 25.5% | 31.3% | 1.6 | 1.2 | +0.3 |
| Scottish Championship | Scotland | 32 | 41.2% | 26.8% | 32.0% | 1.5 | 1.2 | +0.2 |
| Scottish League 1 | Scotland | 29 | 42.8% | 23.7% | 33.5% | 1.5 | 1.2 | +0.2 |
| Scottish League 2 | Scotland | 29 | 42.9% | 22.4% | 34.8% | 1.5 | 1.3 | +0.2 |
The home points per game column is worth paying attention to. In the Greek Superleague, home teams average 1.7 PPG, the equivalent of just under a win every other match. Away teams average just over 1 PPG, that is a gap of almost 0.7 points per game between playing at home and away. In Scottish League 2, the same gap is 0.24. These are fundamentally different environments for home teams.
Why Continental Europe Dominates
Eight of the top ten in the all-time ranking are from continental Europe. All five British entries in the top half of the table are English, and even the Premier League sits only 13th. Every Scottish league fills the bottom four positions.
This geographic pattern is not coincidental. Several factors concentrate home advantage in Southern and Western European football.
-
Stadium atmosphere and crowd intensity. The culture around football in Greece, Turkey, Spain and France tends toward more intense, partisan atmospheres than the typical British ground. Standing areas remain more common in parts of Europe, crowd proximity to the pitch is greater in older compact stadiums, and the relationship between ultras groups and the home end creates an intimidation factor that influences both players and officials.
-
Compact leagues with local rivalries. In smaller leagues like the Greek Superleague or Belgian First Division, many clubs draw from deeply regional support bases. There is nowhere neutral to be - every home crowd knows the players personally and every match carries local identity.
-
Referee effects. Academic research consistently shows referees award marginally more favourable decisions to home teams under crowd pressure. The magnitude of this effect is not uniform, it is stronger where crowd noise is louder and stadium design amplifies it. The no-fans Covid season of 2020–21 produced sharp drops in home advantage across every league, confirming that crowd effects are real and material.
-
British football's structural differences. The four British leagues sitting at the bottom of the table share characteristics that weaken home advantage: large all-seater stadiums with crowds dispersed away from the pitch, higher numbers of neutral supporters at many grounds, and a culture that produces more competitive away support. The Scottish lower divisions in particular show away win rates approaching or exceeding one in three matches, among the highest in the database.
How the Rankings Have Changed Over 30 Years
The all-time ranking tells you the historical picture. The more important question for betting purposes is what is happening now.
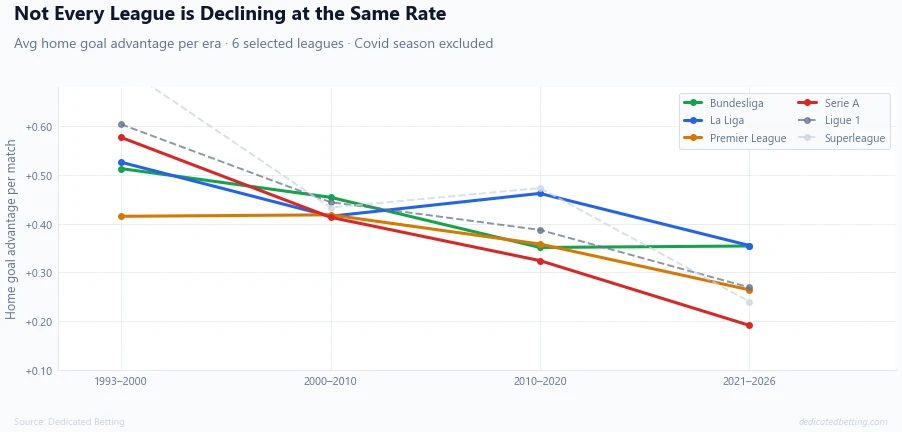
The divergence since 2010, and particularly since 2021, is the most important finding in this dataset. Leagues that historically ranked among the strongest are now producing near-neutral home vs away results. Others have held up better than expected.
The Greek Superleague had the highest home advantage of any league in the 1993–2000 era at +0.724 goals per match. Home teams won nearly 55% of all matches. In the most recent five-season period, that has fallen to +0.24, a collapse of more than two thirds of the original advantage. The reasons are not fully clear from match data alone, but significant changes to league structure, stadium redevelopment, and the departure of some of the most intense supporter groups from certain grounds appear to be contributing factors.
France's Ligue 1 tells a similar story. It was second strongest in the 1990s at +0.60 and has declined steadily to +0.27 in the most recent era - 20th of 22 leagues.
Italy's Serie A shows the same pattern: +0.58 historically, now +0.19. For a league long associated with tactical home dominance and ferocious home atmospheres, that figure is remarkable. Serie A now sits 21st of 22 leagues in recent form.
The Bundesliga has been the most resilient. It has declined from +0.51 in the 1990s, but the decline has been gradual and has stabilised. In the 2021–2026 era it still registers +0.35, the highest of any league in the database for that period.
The Biggest Movers: All-Time Rank vs Recent Form
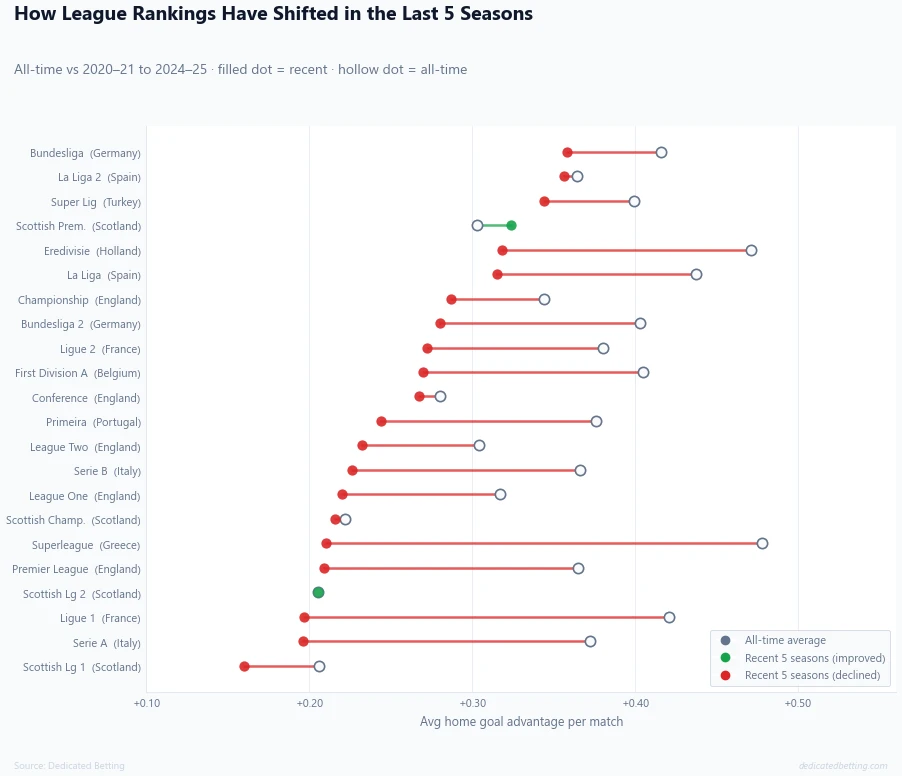
The dumbbell chart makes the individual league movements visible. Most leagues show a red line - recent advantage lower than all-time average. A few show green.
| League | All-time rank | Recent rank | Change | All-time | Recent |
|---|---|---|---|---|---|
| Scottish Premiership | 18th | 4th | ▲14 | +0.3 | +0.3 |
| La Liga 2 | 14th | 2nd | ▲12 | +0.4 | +0.4 |
| Championship | 15th | 7th | ▲8 | +0.3 | +0.3 |
| Bundesliga | 5th | 1st | ▲4 | +0.4 | +0.4 |
| Premier League | 13th | 18th | ▼5 | +0.4 | +0.2 |
| Serie A | 11th | 21st | ▼10 | +0.4 | +0.2 |
| Superleague | 1st | 17th | ▼16 | +0.5 | +0.2 |
| Ligue 1 | 4th | 20th | ▼16 | +0.4 | +0.2 |
The Scottish Premiership is the standout improver, 18th all-time, 4th in recent form. The era data shows it dipped sharply during 2010–2020 (+0.243) before recovering strongly in the current era (+0.39). Whether this reflects specific structural changes in Scottish football or simply regression toward a longer-term mean will become clearer with more seasons of data.
The Premier League's recent decline deserves attention. At +0.21 over the last five seasons it sits 18th of 22 leagues, a significant drop from its 13th all-time position. 2024–25 in particular was a weak home advantage season in the Premier League, with home teams winning just 41% of matches. The league was already below average for home advantage historically. That position has now deteriorated further.
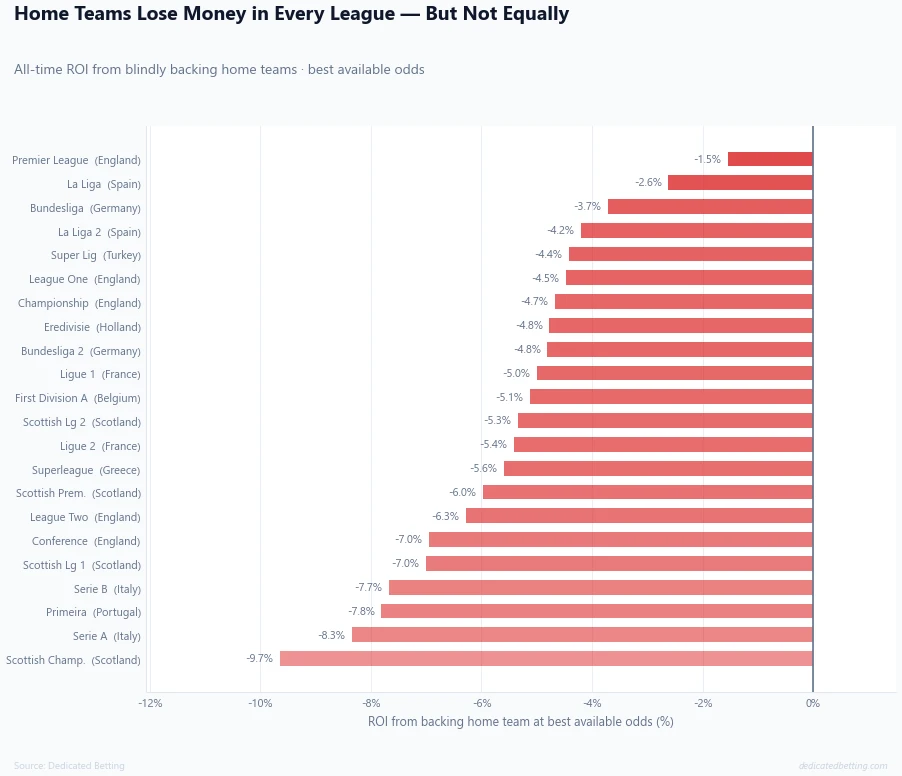
Home Advantage and Betting ROI: The Paradox
Given the wide variation in home advantage across leagues, you might expect leagues with the strongest home advantage to produce the best returns from backing home teams. The data suggests the opposite.
| League | Country | ROI all-time | Avg home odds |
|---|---|---|---|
| Premier League | England | −1.54% | 2.82 |
| La Liga | Spain | −2.62% | 2.63 |
| Bundesliga | Germany | −3.72% | 2.62 |
| La Liga 2 | Spain | −4.20% | 2.27 |
| Super Lig | Turkey | −4.42% | 2.48 |
| League One | England | −4.47% | 2.39 |
| Championship | England | −4.67% | 2.37 |
| Eredivisie | Holland | −4.77% | 2.74 |
| Bundesliga 2 | Germany | −4.81% | 2.30 |
| Ligue 1 | France | −5.00% | 2.49 |
| First Division A | Belgium | −5.12% | 2.46 |
| Ligue 2 | France | −5.42% | 2.29 |
| Superleague | Greece | −5.59% | 2.84 |
| Scottish Premiership | Scotland | −5.97% | 3.05 |
| League Two | England | −6.28% | 2.36 |
| Conference | England | −6.95% | 2.42 |
| Serie B | Italy | −7.68% | 2.31 |
| Primeira | Portugal | −7.81% | 2.89 |
| Serie A | Italy | −8.34% | 2.69 |
| Scottish Championship | Scotland | −9.65% | 2.54 |
The Premier League produces the best ROI from home backing at −1.5%, despite sitting only 13th for actual home advantage. The Greek Superleague, first for home advantage, produces −5.6%. The Scottish Championship, last for home advantage, produces the worst ROI at −9.6%.
This pattern reflects market efficiency more than home advantage strength. The Premier League is the most liquid, most analysed betting market in the world. Bookmakers price home teams more accurately there than in any other competition. The result is tight odds with minimal margin distortion.
In leagues with higher home advantage but less market depth, the pricing is looser in both directions. Bookmakers in Greek or Portuguese football are not working with the same level of data and trading resource as those pricing Premier League matches. The home premium is sometimes overpriced, sometimes underpriced - but across all bets, losses accumulate regardless.
The practical conclusion: high home advantage does not equal high value when backing home teams. The market adjusts. What matters is whether specific home teams in specific contexts are priced at levels that don't reflect their actual probability of winning.
What This Means for Your Betting
Football statistics on home advantage by league give you context, not picks. Here is how to use that context practically.
-
Calibrate your expectations by league. When assessing a home team in the Bundesliga or La Liga, historical data suggests home advantage is a genuine and persistent factor. When looking at a Scottish lower division fixture, the same assumption is materially weaker - away teams win more than one in three matches in those competitions.
-
Treat recent form data as more relevant than all-time averages. The era analysis shows the gap between historical and current home advantage is now substantial in several leagues. A model or approach that relies on all-time averages for Ligue 1 or Serie A home advantage is working with numbers that no longer reflect how those competitions actually play.
-
Use the league and team data on this site. Our league pages include a Home Advantage card in the Betting Insights section showing current season home vs away performance, alongside the league table with a Home-only view. Each team page shows Home vs Away Form in the Betting Profile - home PPG, away PPG, and win rate splits for the current season. For cross-league comparisons, the Best Home Teams ranking covers all 22 leagues and lets you filter by time window from the current season back to the last ten seasons.
-
Treat single-season ROI data carefully. In 2024–25, several leagues produced unusually positive returns from home backing - Scottish League 2 showed +20.6% ROI over 180 matches, the Bundesliga showed −21.5%. Neither figure is meaningful in isolation. Single seasons in smaller leagues carry enough variance to produce outcomes far outside long-run expectations. The all-time ROI table is the reliable reference; single-season results are context, not conclusions.
Summary
Home advantage varies enormously across European football. The Greek Superleague has the highest all-time home advantage in our 22-league database. The Premier League sits 13th. The Scottish lower divisions sit at the bottom.
But the all-time picture is increasingly misleading. Several historically strong home advantage leagues - Ligue 1, Serie A, the Greek Superleague - have seen their home advantage collapse in recent seasons to levels barely above neutral. The Bundesliga has been the most resilient, now leading the recent rankings despite declining from its historical peak.
Strong home advantage does not translate into better betting returns. The Premier League, with below-average home advantage, produces the least negative ROI from home backing. Market efficiency determines returns more than the raw strength of the home factor.
For anyone using football statistics on home advantage to inform betting decisions, the key is precision: which league, which era, which teams, and whether the odds reflect what the current data actually shows.
Final thought: Not all home advantages are equal. The Bundesliga, La Liga and La Liga 2 currently have the strongest home advantage in European football. The Premier League is closer to the middle of the pack - and declining.
All statistics drawn from the Dedicated Betting database, covering up to 239,669 matches across 22 football divisions from July 1993 to May 2026.
Related football articles
Does home advantage still matter in football?
This article looks at home advantage by league. Our main guide examines the broader picture - how home advantage has declined across all 22 leagues over 33 seasons, why it exists, and what it means for the betting markets. Read the full Home Advantage in Football analysis.
Bankroll Management - Don't skip this!
Good bankroll management is what keeps you alive through variance. It’s often the difference between a winning season and a losing one. Our Football Betting Bankroll Management guide breaks down how smart strategy, disciplined staking, and proper risk control can transform your long‑term results.