The betting market is not blind to home advantage. Every bookmaker pricing a football match already knows that home teams win more often, score more goals and earn more points per game than they do away from home. That knowledge is built into the odds before you place a single bet.
Understanding what the market already knows - and identifying the narrow situations where it might have mispriced things - is the difference between using home advantage as a useful input and using it as a system that slowly drains your bankroll.
This article uses 30 years of data across 22 European leagues to explain how home advantage is priced, why the obvious approach does not work, and what to actually do with the information.
Key takeaway: Home advantage is a real, measurable factor. The market prices it in almost entirely. The value is not in knowing it exists - it is in identifying when specific teams, in specific contexts, are priced at levels that do not reflect the actual home edge they carry.
Why Home Teams Are Shorter Odds
Home teams win more often across every major European league. Across our database of 239,669 matches since 1993, home teams win 45.05% of matches, away teams win 28.16%, and 26.79% are draws. Home teams score an average of 1.50 goals per game against 1.14 for away teams.
Bookmakers set odds to reflect the actual probability of each outcome. When home teams win nearly half of all matches, the market has to price them as favourites in a large proportion of games - and does. The average home team in our Premier League dataset is priced at 2.78 to win. At those odds, they would need to win 36% of the time just to break even. They actually win 44% of the time at home, which sounds like value - until you factor in the bookmaker's margin and the full range of home, draw and away outcomes being priced simultaneously.
The market is not just counting wins. It is pricing the full probability distribution of every match, including the likelihood of different scorelines, margins and timing. By the time home advantage reaches the odds, the mispricing opportunity has largely been closed.
The Raw Numbers: How Advantage Has Changed
Home advantage has declined meaningfully across eras. For anyone applying assumptions based on older data, the numbers look noticeably different from what the current market reflects.
| Era | Matches | Home win % | Draw % | Away win % | Home goal advantage |
|---|---|---|---|---|---|
| 1993–2000 | 43,008 | 47.2% | 27.6% | 25.2% | +0.5 |
| 2000–2010 | 73,636 | 45.8% | 27.1% | 27.1% | +0.4 |
| 2010–2020 | 76,940 | 44.4% | 26.5% | 29.1% | +0.3 |
| 2021–2026 | 38,437 | 43.3% | 26.2% | 30.6% | +0.3 |
Away teams won one in four matches in the 1990s. They now win nearly one in three. A betting model built on historical averages from the 1990s or early 2000s is using the wrong baseline - not just slightly wrong, but structurally wrong.
The market has tracked this shift. Average home odds in the Premier League rose from around 2.28 in the early 2000s to a peak above 3.00 in the late 2010s as away performance improved. The market adapted faster than many bettors' mental models did.
Why Blindly Backing Home Teams Loses Money
The most straightforward test: back every home team at best available odds across every league, every season, level stakes. Our database covers 182,123 matches with odds. The result is a return on investment of −5.90% - a consistent loss across all 22 leagues, all eras, all sample sizes.
Not one league produced a positive return from this approach across our full dataset.
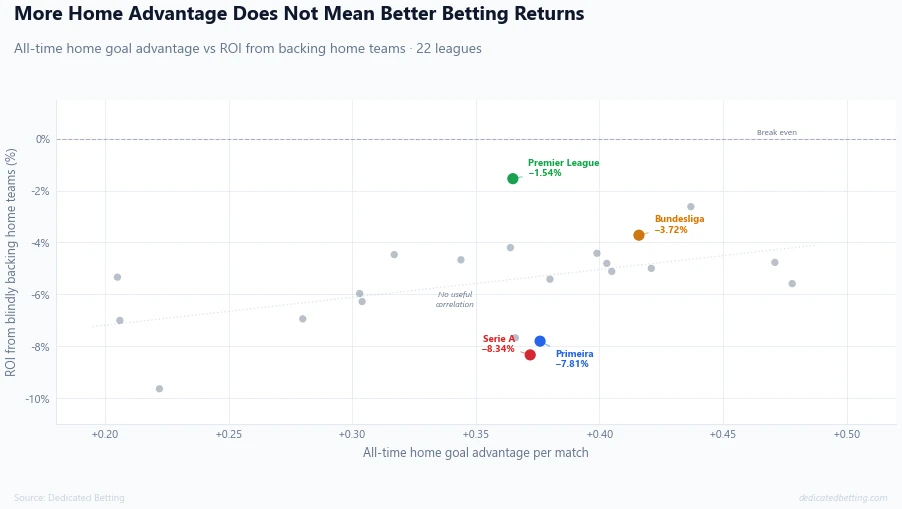
This chart contains the core argument. The scatter of 22 dots shows no meaningful relationship between how strong a league's home advantage is and how much money you make backing home teams there.
The Premier League sits at the right-hand side - below-average home advantage by European standards - yet produces the best ROI of any league at −1.54%. The Primeira Liga (Portugal) has stronger home advantage than the Premier League, yet produces −7.81%. Serie A, historically one of Europe's most atmosphere-driven leagues, is one of the worst at −8.34%.
The explanation is market efficiency. The Premier League is the most liquid, most analysed betting market in the world. Bookmakers devote more resource to pricing it accurately than any other competition. The result is tighter margins and less mispricing in both directions. In the Portuguese or Italian leagues, the home premium is sometimes overpriced and sometimes underpriced - but across all bets, the bookmaker's margin does its work regardless.
Strong home advantage does not equal better value when backing home teams. The market adjusts.
The League Context: Where Home Advantage Is Strongest Now
Home advantage varies considerably across leagues - and has shifted significantly in the last five years for several competitions. Here is the current picture for the 12 most-bet European leagues.
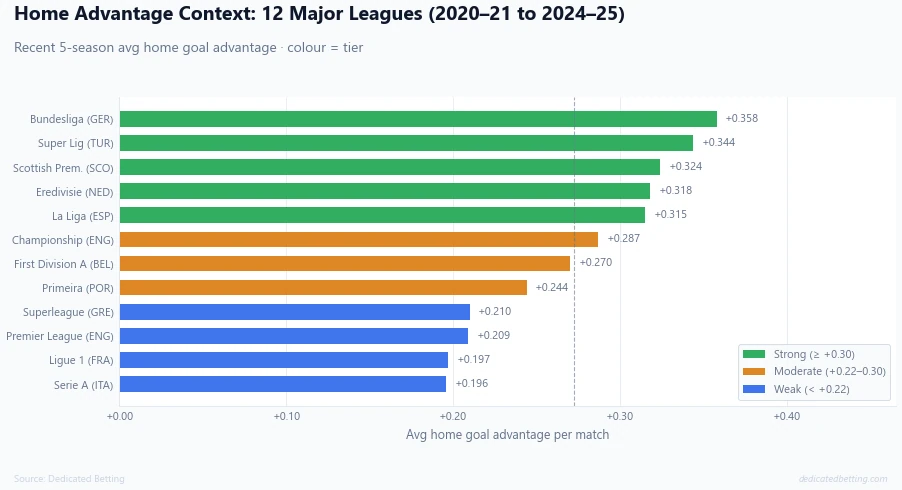
The tier groupings reflect what the data actually shows in the current era:
| Tier | Leagues | Recent home goal advantage |
|---|---|---|
| Strong | Bundesliga, Super Lig, Scottish Prem., Eredivisie, La Liga | +0.32 to +0.36 |
| Moderate | Championship, First Div. A, Primeira | +0.24 to +0.29 |
| Weak | Superleague, Premier League, Ligue 1, Serie A | +0.20 to +0.210 |
The weak tier contains some of the most famous competitions in world football. Ligue 1 was historically among the strongest home advantage leagues in Europe - it is now one of the weakest. Serie A similarly. The Premier League has sat below the European average for most of the last five seasons.
This matters for your analysis because the baseline expectation you apply to a home team in the Bundesliga should be materially different from the one you apply to a home team in the Premier League or Serie A. Using one generic assumption across all competitions is not neutral - it is systematically wrong in both directions.
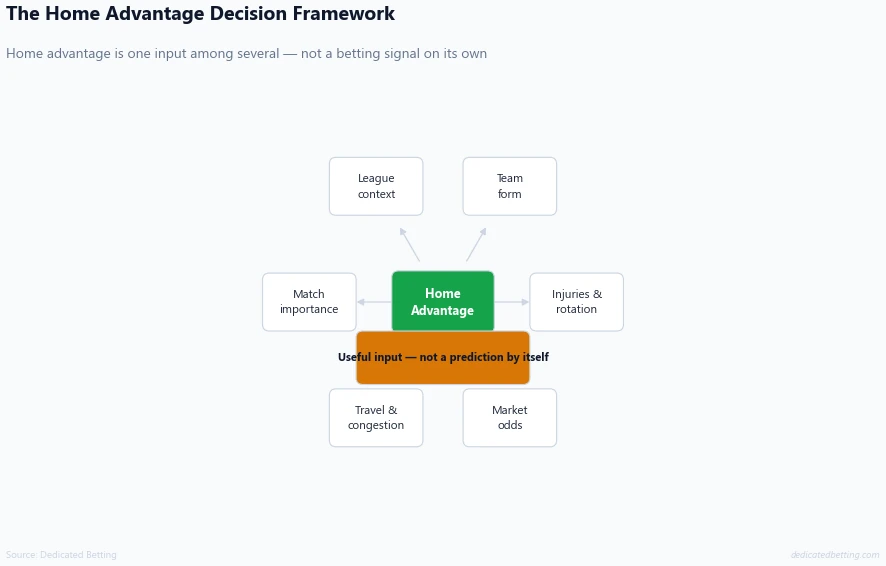
When Home Advantage Is a Useful Input
Knowing the limitations of home advantage as a betting factor is not the same as concluding it is worthless. It is a genuine, measurable input - the question is how to use it precisely rather than bluntly.
-
Layer it with league context. A home team in the Bundesliga (recent advantage +0.358) carries a meaningfully different baseline than a home team in Serie A (recent advantage +0.196). Before assessing a specific fixture, knowing which tier the competition sits in gives you the right starting expectation. Our league pages show the current season home advantage data and a Home Advantage card in the Betting Insights section - that is the live reading for the competition you are looking at.
-
Focus on team-level splits, not league averages. The league average is context, not a prediction. What matters is whether the specific home team performs significantly better at home than away from home. A club with a home PPG of 2.10 and an away PPG of 0.90 has a genuine, structural home advantage that is larger than the league average. A club with a home PPG of 1.50 and an away PPG of 1.40 is almost neutrally split - the home setting barely affects them. Our team pages show the Home vs Away Form split for the current season, letting you see this distinction for any specific fixture.
-
Look for the odds mispricing, not the home advantage. The useful question is not "does this team have home advantage?" - they almost certainly do, to some degree. The useful question is "does the current price reflect their actual home performance level?" A strong home side priced at 1.35 may already have the home premium absorbed and then some. The same team priced at 2.00 in a context where their home form suggests a genuine win probability above 50% is a different conversation entirely.
-
Weight recent form against the historical baseline. Home advantage is a long-run tendency. A team on a run of poor home results this season, sitting below even their league's weak average, is not the same proposition as a team performing at their historical home level. The Best Home Teams ranking covers all 22 leagues with time windows down to the last 10 matches - useful for distinguishing genuine home strength from a short burst or slump.
-
Treat the market's era adjustment as information. The era ROI data in our database shows the market was slow to reprice home advantage during 2010–2020, when the advantage was declining but odds had not fully caught up. That produced the least-negative ROI of any era (−3.14%). When home advantage in a specific league is shifting structurally - either declining or, as in the Scottish Premiership's recent recovery, strengthening - the market can lag. Being aware of that lag is where genuine analytical edge can exist.
A Practical Note on Responsible Gambling
Home advantage is one analytical input among many. No single factor - however well-supported by data - removes the variance and bookmaker margin that make profitable betting difficult to sustain over the long run.
If you are using data to inform your betting, our Responsible Gambling section covers staking principles, loss limits and the realistic expectations anyone approaching football betting analytically should hold.
Summary
Home advantage in football is real, measurable and well-documented across 30 years of data. Home teams win 45% of matches, score more goals and earn more points per game than they do away from home.
The market knows all of this. Blindly backing home teams across all leagues produces a consistent loss of −5.90% over 182,123 matches. Not one league produces a positive long-run return from this approach.
The scatter chart above confirms the central point: more home advantage does not produce better betting returns. Market efficiency, not raw home advantage, determines ROI.
The practical use of home advantage data is more specific: knowing which league tier you are operating in, understanding whether a particular team's home form is genuinely above average or just riding the league-level tendency, and identifying whether the current odds reflect that reality accurately. Those are the narrow, precise questions where home advantage data adds genuine analytical value.
Final thought: The odds already know home teams win more often. What they sometimes miss - briefly, in specific contexts - is the precise magnitude of a particular team's home edge in their current form. That gap is where the data becomes useful.
All statistics drawn from the Dedicated Betting database, covering 239,669 matches across 22 football divisions from July 1993 to May 2026.
Related football articles
Which leagues have the biggest home advantage?
Our League Comparison article ranks all 22 leagues by home advantage across 30+ years, including the biggest risers and fallers in the current era.
Is home advantage declining in the Premier League?
The full 33-season analysis of Premier League home advantage - including the goals data that explains the mechanism - is in our Premier League home advantage article.
Football teams with the strongest home advantage
For team-level home fortress rankings across all 22 leagues, including the current top 20, see our team home advantage article.